Case Study – Ikebana luxury apartments, 130 Dudley St, West Melbourne VIC

It’s not terribly often we have a case study with a strong Japanese influence, let alone such a rich and detailed effort to showcase the majesty of the architecture. The word Ikebana translates as the Japanese art of flower arrangement and is an apt name for this stunning new development.

Ikebana luxury residences comprise of 248 Japanese inspired apartments.  It consists of 133 two-bedroom apartments and 108 one-bedroom apartments and the Gurner trademark of extensive communal facilities. Designed by award-winning architects Elenberg Fraser, Ikebana is about the beauty and quietude of nature.

According to architects Elenberg Fraser, “the medium-density apartments celebrate the artisanal detail of Japanese handcrafts, with a torn paper façade and delicate screening. Integrated courtyards inject a natural connection – a tranquil moment of relaxation in an urban setting. With all apartments sold out, people were quick to snap up a piece of inner-city zen!”

The rooftop showcases the Ikebana Private Club featuring landscaping by renowned gardener Jack Merlo, a teppanyaki grill, karaoke lounge, indoor/outdoor lounge, a firepit and private dining areas. Merlo has also designed lush sunken gardens between the three buildings.

A unique feature of Ikebana is the two VIP Spa Retreats, which can be booked at no cost by residents for private entertaining with their own spa, barbecue, bar and moonlight cinema.

“When you want to get away with your friends for a rooftop barbecue overlooking the CBD, you don’t necessarily want to be there with everybody else so we’ve created these two spaces that residents can book for the night and take 10 to 20 friends up there,” says Gurner CEO Tim Gurner.

Two-bedroom apartments range in size from 54 to 79 square metres internally with balconies from seven to 49 square metres. They went to market from $511,000 to $750,000.

The one-bedroom apartments are sized from 45 to 46 square metres internally with outdoor space of seven to 36 square metres and prices from $360,000 to $480,000. Most apartments come with a car park, with 199 car spaces in the project.

We’ve been lucky enough to have been engaged by investor purchasers to provide depreciation schedules on Ikebana, and the depreciation entitlements are significant.

Investors purchasing smaller apartments in Ikebana can expect upwards of $13,000 within the first full year of claim, which isn’t bad for 40 odd square metres of internal living. Larger two-bed room apartments will achieve closer to $20,000, within the first year.

An estimate of the range of potential deductions for investor purchasers is shown below.

Ikebana West Melbourne 2 300x197 - MCG Quantity Surveyors Ikebana west melbourne 300x261 - MCG Quantity Surveyors

Tax Depreciation Calculators – Is there merit in the estimates?

Google is telling us that more and more people are searching for a ‘tax depreciation calculator’. Admittedly, this search ranked well below the top 2016 result of ‘US Election’ and even a few million short of number 6 ‘Pokemon Go’.

Putting the self-deprecating Quantity Surveyor stuff to the side for a moment, searching for an online depreciation estimate is a trend that’s likely to continue. Even so, we’re resisting the temptation to build a calculator. Why? I’m glad you asked.

Online calculators should be fairly accurate in calculating a tight minimum and maximum range for, say a brand-new project home. Yet comparing a few existing calculators online shows that the range between them is not particularly tight at all. I worry that there’s the potential to overpromise and under deliver, in the hope of winning the work.

The project home type property should be the easiest property to estimate of them all, let’s run through an example. (Strap yourself in, perhaps only engineers, accountants and depreciation guys will take pleasure in this.)

Firstly, we need to calculate the total construction cost. From a high-level perspective, the best way to do this is to take the size of the property, and apply industry rates at a cost per square metre. Note that we’re not considering the type of block (sloping etc.).

So, an off the shelf 2016 construction handbook would say a 180 sqm brick veneer home with a medium standard finish in Sydney would cost around $1,175 to $1,265 per square metre. This gives us a construction cost of $211,500 to $227,000.

Let’s assume the $227,000 figure is most accurate. With that we can calculate that it’s impossible to have less than $5,675 worth of deductions within the first full year. Why? Well, the minimum depreciation rate is 2.5% for capital works, so 2.5% of $227,000 is $5,675.

It’s impossible to have less than $5,675 in total depreciation deductions, because we’re talking about a hypothetical house without a toilet. Not just that, but air conditioning, hot water system, cooking appliances, carpets, blinds etc.

In my experience, a house of that value/type would have between $20,000 to $30,000 worth of these types of assets (plant and equipment assets).

This is where the depreciation gets a little trickier. Let’s say there’s $25,000 worth of plant, that means we now must deduct that from the construction cost to adequately calculate the capital works deductions. So, that would be $227,000 minus $25,000 = $202,000 X 2.5% = $5,050.

Then there’s the $25,000 worth of plant items. Some of it will depreciate at 100%, other assets at 18.75%, and some as low as 10%. Carpet will be 20% under the diminishing method and 20% is probably the fairest middle ground for all plant items. So again, trying to stay high level, we’ll call all plant assets 20% on average.

This will give us the following table;

Untitled1 300x54 - MCG Quantity Surveyors

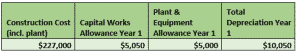
Seems simple enough, and the capital allowances part almost is. Yet the plant and equipment assets will not decline in value the same way each year. Some assets will be gone completely, other assets depreciation rates may change once the value reaches a certain point. All these things must be ‘estimated’ and they make the year 2, 3 and so on calculations a little more complex.

On top of this, right at this very second, we’re completing a report on a 178 square metre home with an actual known cost to build of $365,000! How does the average investor know the standard of finish and even with Miele appliances and plush carpet, how can there be that much variation?

This is where a Quantity Surveyor cannot easily be replaced with a robot, despite some of the personality similarities, and we’re talking about a brand-new home after all. If we’re finding complexity here, how accurate do you think a calculator would be in one of these scenarios;

  1. The client bought the property 15 years ago, it was 8 years old at the time but the previous owner added a deck and converted the garage into a home office.
  2. The client lived in the property for the first 4 years, and wants to assess whether they’ll get sufficient deductions in financial year 5 on their 12-year-old unit in a complex of 78 units with a swimming pool and gym.
  3. The property was built in 1996 in remote QLD and some materials needed to be brought in via a barge. The property was retiled and painted in 2011 after storm damage and has just had an extension to increase the size of the main bedroom and to build an ensuite.

I love the fact that property investors are now much more educated about their depreciation entitlements, us Quantity Surveyors have been educating people for years. It’s important though to understand the limitations of online calculators, and the inherent risk in relying on numbers calculated using a helicopter view and some average data. Once you get past the brand new house or townhouse, things can head in a myriad of directions and costs become much less predictable.

Nothing will beat an actual report prepared by an expert after a thorough site inspection and historical research. However, if you are looking to do your sums on a potential purchase or assess whether a depreciation report may provide some value over the cost, you’d be much better served picking up the phone or sending an email to a recognised tax depreciation expert. The more information you have about the property the better, and the greater the accuracy of any estimate.

Safe calculating!

Mike Mortlock, Managing Director – MCG Quantity Surveyors

Capital city dwelling values up, with pace of growth slowing.

Across the combined capital cities, dwelling values have increased by 7.1% over the 12 months to September 2016, a figure much lower than the 11.0% increase in values over the previous 12 months. So, whilst dwelling values certainly aren’t tracking sideways, the pace of growth has slowed markedly, yet is still relatively strong. Rental rates on the other hand, are falling and showing their largest declines in more than 20 years.

October dwelling values speak to this slowing pace, rising by 0.5%, compared with a 1.0% lift in September and 1.1% rise in August.  The latest monthly housing market data takes the quarterly change in capital city dwelling values to 2.7% and 7.5% higher over the past twelve months.

Apart from Adelaide, Hobart and Perth, every capital city recorded a rise in dwelling values over the past three months, with the Canberra housing market recording the largest increase in values after a 5.6% quarterly rise.  Growth in the Canberra property market largely relates to rising house values, with unit values increasing at less than half the pace of detached housing.

Index results as at October 31, 2016

Index results 300x140 - MCG Quantity Surveyors

Sydney continued as the stand out capital based on annual capital gains, recording the largest year-on-year increase; dwelling values are now 10.6% higher over the past 12 months.  Houses lead the charge, with the supply side for high density housing taking up a lot of the demand. Units are in demand in so far as they are at a lower price point, but there are concerns around the number of dwellings coming onto the market.

According to CoreLogic economist Tim Lawless, the divergence in performance between houses and units is most clearly evident in Melbourne and Brisbane.  The annual rate of capital gains in Melbourne remains strong at 9.1%, however there is a substantial difference in growth rates between houses and units, with house values up 9.6% compared with a 5.2% increase in unit values over the past year.  Brisbane’s housing market has shown a larger capital gain spread, with house values up 4.7% compared with a 1.4% fall in unit values over the year.

He said, “The weaker performance of unit values across the Brisbane market may be partially attributed to supply concerns, as unit supply levels across key regions of Brisbane’s inner city show the potential for a significantly larger relative increase in existing stock levels when compared with Melbourne and Sydney.”

Granny Flats & Tax Depreciation – What can you claim?

If you’ve built a granny flat or are considering one, you’ll be interested to note that the depreciation deductions can be significant. Whilst we’ve seen granny flats from under $100,000 to more than three times that in value, let’s take a look at an exceptionally average one to see what the deductions are worth.

This was a property in Western Sydney.

88862857 ecdf 426b 9119 aff2d3cb696f - MCG Quantity Surveyors
As you can see from the picture below. It was a fairly simple and cost efficient type of construction.
granny-flat
From a depreciation perspective, a granny flat normally contains everything you’d expect in your average house. A bathroom, kitchen, floor coverings, window furnishings and the like. You can make out a hot water system from the picture, and there was a pump attached to the water tank as well.
The total construction cost for the granny flat came in at a pretty economical $112,800, with a $5,500 fence being installed on top of this a few days later. In terms of cost per square metre, the cost is a little higher than an average house given the apportionment of development application fees being on a smaller size, and percentage of bathroom areas and other high cost components tend to be larger than within a house containing larger open spaces. The difference equates to about $300 more per square metre in a granny flat.
The plant and equipment items consisted of:

  • Bathroom Assets – Freestanding Accessories
  • Ceiling Fans
  • Exhaust Fans (inc. Light & Heating)
  • Hot Water Systems
  • Kitchen Assets – Cooktops
  • Kitchen Assets – Ovens
  • Kitchen Assets – Range hoods
  • Light Shades, Removable
  • Pumps
  • Smoke & Heat Alarms
  • Window Blinds, Internal
  • Window Curtains

Interestingly, the whole floor was tile, which in the end minimised the deductions for the first few years of claim as tile depreciates at 2.5% of its value per year, whereas carpet would normally be 20%. Still, in the first full year of claim the $11,178 worth of plant and equipment assets equated to over $2,300 worth of deductions. Had the property been constructed on the 1st of July, that figure would have been over $2,500.
The building component came in at $101,622 and net result for the first full financial year was total depreciation being just over $5,000.
The first year allowed for 259 days of claim within that financial year and it achieved over $4,100. The total for the first 5 years of claim was $21,095. Not bad considering the average finishes and size of the granny flat.
So if you’ve taken the plunge and invested in a backyard granny flat, be sure to take advantage of the solid deductions available. Based on an average income, you could see around $6,000 – $7,000 back in your pocket!
*Note: Average income figures sourced from ATO and figures are shown as a guide only. Your individual tax situation is complex and an accountant’s advice should be sought. These figures should not be relied upon.

Melbourne Southbank’s Bella Apartments – A Depreciation Case Study

The iconic and aesthetically pleasing Bella Apartments is a landmark of Melbourne’s Southbank. We were delighted to prepare another depreciation schedule for one of the units just this week and thought it would be great to provide an insight into the development.

Bella 295x300 - MCG Quantity Surveyors

Salvo Property Group’s $55 million Bella is a 33 level tower comprising of 228 apartments in one and two bedroom configurations, including a gym and ground level retail tenancies. There are also three levels of car parking that contain a car lift and bike storage.

Some 200 people worked on-site during the construction of the Bella Apartments. It contains a number of ESD features including water efficient fixtures and appliances and energy efficient glazing which was used throughout.

From a depreciation perspective, it’s a great investment with extensive common areas and equipment including multiple lifts, gym equipment, sophisticated fire and security services with multiple parking levels.

Southbank 300x259 - MCG Quantity Surveyors

Our clients 2-bedroom apartment was able to achieve over $1,000 worth of deductions per month for the first 18 months of ownership. This was the result of over $32,000 worth of total plant items across the unit and shared common areas and over $200,000 worth of depreciation on the shared common, and unit specific building structure.

To further illustrate the potential claims for investors in the Bella apartments with a similar unit, I’ve prepared an estimate below as a guide.

Southbank Phase A 265x300 - MCG Quantity Surveyors

Good news for property investment co-ownership with split deductions.

The proportion of properties jointly owned is quite high, and with greater education on tax minimisation practices, we’re seeing a lot more obscure ownership percentages like 70/30 or even 99/1.

Why are people employing these types of ownership structures? It all comes down to which party can benefit the most from the deductions.

Take for example a couple who decide to invest in property. Person 1 earns $160,000 per year, and person 2 earns $45,000 per year. Let’s assume that between depreciation and the net loss on the property after rent and interest, there’s $30,000 worth of deductions across the whole property. The scenarios could be as follows in the 2015/2016 financial year;

Senario 1 300x204 - MCG Quantity Surveyors

Senario 2 300x215 - MCG Quantity Surveyors

The net result is that in scenario 2, the total tax saved for the couple is $10,903, as opposed to $8,720. So as a household, purchasing the property in shares of 95 and 5 per cent respectively, saved them an extra $2,183 together than it would have as 50/50 owners.

So apportioning the net losses to the highest wage earner is an effective strategy.

Depreciation schedules can also provide an additional benefit based on some key calculations for accelerated rates. Let’s look at two major ways in which deductions can be supercharged;

  1. 100% write-off – Assets (not part of a set) with an opening value less than $301.
  2. Pooling – Assets with an individual opening or residual value of less than $1,000

Pooling rates are either 18.75% in the year of acquisition or 37.5% each year thereafter. Most assets that aren’t written off at 100% or pooling would depreciate at rates significantly lower than 37.5% such as carpet, which would depreciate at 20% each year under the diminishing value method.

Once we understand these main concepts, we can see how a split ownership structure can become beneficial.

Take carpet for example. If there’s $1,900 worth of carpet in a report owned by one entity, it would depreciate at 20% of its residual value each year. However, if the property is owned in a 50/50 structure, each owners portion of the carpet is worth 50% X $1,900, or $950.

Straight away, the carpet in each separate report would qualify for low value pooling rates of 18.75 in the first year, and 37.5% each year thereafter. There’s an additional advantage with pooled assets and the pro-rata calculation as well, but that’s another article!

Looking into the impact of split reports on assets under $301, let’s consider the property has one air conditioning room unit worth $580. As one entity, a room unit would qualify for the low value pool, but not as an asset that can be written off at $300 or less. However, with a 50/50 split, the asset is now worth $290 to each person, therefore allowing it to be an instant deduction. Each party will receive a $290 in the first financial year.

When we prepare these split reports, we prepare a master report showing the property deductions as one entity, and then the deductions in a separate report for each party. We’re often receiving calls from accountants asking why the figures don’t add up. The total deductions will be the same over the lifetime of the report, but the yearly deductions will be higher when spit apart, than what they would be together.

In a real world case study recently completed by our office, we had a very average property showing $2,144 worth of deductions within the 1st partial year, and $2,015 in the 2nd year. Under the split arrangement, the totals were $3,240 for the 1st partial year and $2,009 in the second year. Essentially this couple we’re able to bring forward their deductions earlier, and we all know a dollar today is worth more than a dollar tomorrow!

CoreLogic dwelling values rise in September, RBA place doubt over previous figures

The month of September was a good one for capital city dwelling values, with all but Perth and Darwin trudging forward. Capital city values are also up 2.9% over the quarter.

On these figures though, there has been a lot of coverage of the inflated CoreLogic figures for April & May. In RBA governor Glenn Stevens’ statement explaining the most recent rate cut, he observed that “dwelling prices have been rising only moderately over the course of this year”.

That statement was at odds with CoreLogic data on home prices, released just the day before, that showed 6.1 per cent growth in home prices nationally, year-on-year, with much stronger results in Melbourne and Sydney.

The discrepancy was explained in the RBA’s quarterly Statement on Monetary Policy, realised on the 5th of August, which relied on data from APM (part of Fairfax’s Domain property group) and the Real Estate Institute of Australia.

In the statement, the RBA explained that it has disregarded CoreLogic’s data because it appeared to significantly overstate price growth in April and May.

“While one source of data recorded strong growth in housing prices in April and May, that growth appears to have been overstated and other sources suggest that housing price growth was modest over those and more recent months,” the bank noted.

It appears that a methodology change by CoreLogic, implemented during April, may have contributed to higher index values in those two months than were warranted by actual transactions.

The RBA have noted that “the risks associated with high and rising household sector leverage and rapid gains in housing prices have diminished.” Septembers figures are shown below.

Index results as at September 30, 2016

MCG 300x139 - MCG Quantity Surveyors

Combined Capital City Dwelling Values up, led by Sydney & Melbourne

Sydney and Melbourne continue to post strong results, showing a consistent 1% growth per month in dwelling values, with the sum of regional areas relatively flat.

In Sydney and Melbourne, cumulative growth in dwelling values over the cycle (June 2012 to date) now stands at 64% in Sydney and 44% in Melbourne.This result highlights the differences in growth trends across the capital cities over the same time period. Outside of Sydney and Melbourne, the third highest rate of capital gain over the cycle to date was in Brisbane at 18%, and was as low as 4% over this same period in Darwin.

Index results as at August 31, 2016

Core Logic Data

CoreLogic head of research Tim Lawless said, “Despite a strong month-on-month reading, the pace of annual capital gains has trended lower compared with the 2015 peak in growth conditions, when capital city dwelling values were rising at 11.1% per annum.”

“The most recent twelve month period has seen dwelling values rise by a lower 7% per annum.  However, the rate of annual growth in Sydney has virtually halved from a recent 18.4% peak to the current annual rate of 9.4%.  Similarly, in Melbourne the annual growth trend peaked at 14.2% per annum last year and has since tracked back to 9.2% per annum over the most recent twelve month period.”

Perth and Darwin remain as the only capital cities to record a fall in dwelling values over the most recent twelve month period, declining by 4.2% in both cities.  Mr Lawless said, “Softer economic conditions and a significant fall in overseas migration rates, together with an increasing net outflow of residents to other states and territories, has made a substantial dent in housing demand. This has resulted in corresponding declines in both dwelling values and rental rates.”

Demonstrating the decrease in housing affordability, utilising household income data for the June quarter provided by the Australian National University, the household income to dwelling price ratio was 8.4 in Sydney and 7.2 in Melbourne, compared to 5.7 in Brisbane.  Prior to the current growth phase, affordability ratios were much lower, with Sydney and Melbourne both showing a dwelling price to income ratio of 6.7.

Property in Scotland – Is it the next hot spot for you as an investor?

Pardon the tongue-in-cheek title, but the whole hotspot thing can be a little tiresome. We are much more in favour of long term fundamentals than volatile pockets and mining towns. What do we here at MCG know about the Scottish property market? Absolutely nothing! However, when one of our clients asked us to complete a depreciation schedule on their Scottish property, we were happy to oblige.

The property was in Menstrie, which is a village in the county of Clackmannanshire. It is about 8 kilometres east-north-east of Stirling and is one of a string of towns that, because of their location at the base of the Ochil Hills, are collectively referred to as the Hillfoots Villages or simply The Hillfoots.

The property itself was built by our clients in 2005. Thankfully we were furnished with a complete set of plans, as well as an on-site inspection with plenty of accompanying photos.

The property is a 4 bedroom detached two storey home with a beautiful bay windowed lounge. Whilst the property was constructed by a builder, our clients added plenty of value themselves such as carpets, floating timber floors, curtains, carpets, white goods and extra lighting. The extras totalled over $20,000 and whilst the clients could have claimed these assets with their accountant directly (as there was no estimating required), we rolled these assets within the greater schedule to give them a nice neat package moving forward. The main component was the original construction itself, which is providing over $6,000 worth of deductions per year.

The end result for our client was a potential back claim of just shy of $16,000 and a total depreciation figure for the 2015/2016 financial year of $7,282.

The perceived difficulty of having this report prepared, would certainly have delayed the clients in having the report prepared. However, as you can see, the deductions will benefit the clients greatly with a minimum of $6,000 of deduction each year right through to 2044. It’s reports like this that make it difficult to answer the question “Which areas do you cover?”

Overseas Investment Properties & Depreciation

Whilst it’s certainly not the sort of reports we target, a number of our clients own investment properties overseas. If you’re claiming the rental income in Australia, then you’re entitled to minimise your tax via having a depreciation schedule completed.

To date we’ve completed many reports for overseas investors in places like the United States, United Kingdom, Malaysia, India, New Zealand and more.

How do we do it?

Essentially, it all boils down to accurately estimating the costs. We’re experts in depreciation legislation in Australia of course, and also construction cost estimating across Australia. It’s important to remember that construction costs vary across Australia’s capital cities and regional areas. In fact, it’s 80% more expensive to build in Weipa (far north Queensland) than it is in Brisbane. The index is in Australia is based on the capital city of each state. So in Queensland it’s Brisbane with an index of 100, and Weipa has a regional index of 180.

When estimating construction costs overseas we need to consider the following;

  • Typical construction costs in the closest capital or major city
  • The regional index of the place we’re estimating (i.e. Jaipr vs New Delhi)
  • The changes in construction cost over time (i.e. it was cheaper to build 2 years ago than it is today)
  • The currency conversion rate
  • The historical currency conversion rate at the time of construction


There’s a few tricks we have up our sleeve to find this information, but once we know the cost to construct in a particular city today, we’ll do the following:

  • Apply any applicable regional index
  • Apply local building price indices (these track the movements of costs over time)
  • Apply historical currency conversion rate (from Euro’s to AUD for example)

Whilst all of our investor clients with properties in Australia will have their properties inspected by a member of the MCG team, overseas properties are not inspected in the same way.

The best information we can receive is floor plans, specifications lists and even actual costs when available. We’ve also pioneered a checklist which walks our on site contacts through the process of measurement, asset identification and cataloguing that enables us to complete the inspection remotely, often carried out by a property professional on the ground or the client themselves. I must assert however, that this remote method is never as good as actually being on the ground ourselves. Our staff are trained to detect improvements, renovations, plant assets and identify variations in the age of both building and plant components. We strongly advocate that properties within Australia do not have their depreciation calculated in this way. Additionally, if the information we receive is not up to scratch, we’ll keep working with the contact until we get exactly what we need prior to completing a report.

It boils down to the best possible method of capturing the specifics of the building overseas. As much as we’d love to travel overseas to inspect these properties ourselves, our clients wouldn’t not be pleased with a bill for overseas travel! It’s certainly too cost prohibitive.

However, when it is possible, it’s certainly a great way for investors to maximise their cash flow. In fact, our last overseas client achieved over $8,000 worth of depreciation on their home in Scotland. We’ll worth the effort if having a report done.