Featured Articles

construction estimating
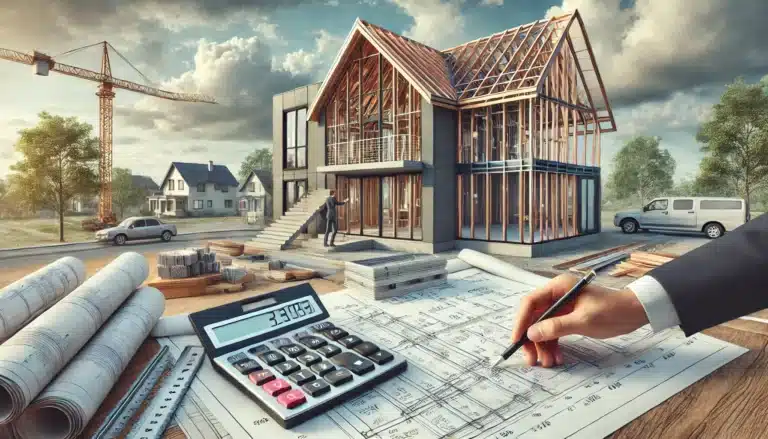
Construction Estimating 101: A Beginner’s Guide to Accurate Project Costs
Accurate project costing is the backbone of any successful construction project. Whether you’re a seasoned contractor or just starting in the industry,…

Construction
What You Need to Know About Australian Construction Costs in 2024
As you’re probably aware, Australian construction costs have been in the news after posting an 11.9% growth rate in 2022. You’ve probably…