You Have Missed The Boat There Is An Embargo – Insurance update

The bushfires have steadied, the fires that were out of control are now under control, if not now largely all extinguished. It is now time for the long road to recovery. Many endless hours of insurance assessing, demolition of existing destroyed properties, delays due to contaminated waste (older house with asbestos), thousands of kilometres of fencing to be erected and then time to rebuild the properties and in some cases the rebuild the stock numbers and lost fauna.

Yes, it all seems gloomy, but it is progress.

Yes, it will be slow, and frustrations will be vented. Due in part to the apparent lack of speediness by the various people involved in this complicated process.

Hold in there.

The world is in damage control with the coronavirus outbreak (COVID-19) that appears to have it origins and ignition point in Wuhan, China at Christmas 2019. Now rapidly spreading across the globe to have now impacted some 80,000 + people.

Why all the doom and gloom, especially from a quantity surveyor holed up in the comfort of his office.

I mean the content of this article thus far is not exactly screaming “positivity or would be used at an inspiration seminar”.

Perspective people, perspective.

I wanted to make you aware of a word……. Embargo.

Noun

an official ban on trade or other commercial activity with a particular country.

“an embargo on grain sales”

verb

impose an official ban on (trade or a country or commodity).

“all of these countries have been embargoed by the US”

Sure, I would think you have heard about this term before. Within the example used in the Noun above, it is not just applied or used on grain sales.

To revert back to the opening line of this article, “The bushfires have steadied……”.

Did you know that many of these areas that were engulfed by fire and destruction had been, well, there was an embargo in place on property insurance in those areas?

That’s right, it is a very common practice that insurance companies and insurance underwriters will place an embargo on a particular postcode or geographical area if they believe they are exposed to massive loss.

This is not to say that if you already have insurance in place that it is void, however it does mean that should you not have insurance, or you have let it expire, they very well may not allow a new policy to be put in place on your property. In some cases, you are not even allowed to amend your already current insurance policy.

As an example, if you have an existing policy and you have just erected a new metal shed / garage in the backyard, you should consider increasing your policy or add it to your policy. If the area was embargoed, you may very well be under insurance as it may not be included for a period of time.

What is the reason for today’s article?

As Benjamin Franklin famously once said,

“Don’t put off until tomorrow what you can do today”.

It may well be too late if a storm is on the way or a fire is ranging toward the back fence or water lapping at the street frontage.

An embargo restriction applied by an insurance underwriter may be placed on a geographical area simply based on the fact that the insurance underwriter believes that an area, or areas, is extremely likely to be impacted. Not always that it IS ACTUALLY being impacted, but likely to be.

I guess an example here would be a cyclone warning and a projected path.

The embargo or restriction on an area usually comes with a timeframe, which would seem logical, for example 72 hours or 7 days.

From the insurance underwriter perspective, in the past, they have been exposed to scenarios where a client does not have any insurance in play, however when a warning of an event or as an example a cyclone or bushfire is on its way, take out an insurance policy.

After the threat has past, make additional contact with the insurance underwriter and cancel the policy.

Embargoes on insurance are a normal and accepted practice, and usually apply to new policies. They typically take effect when events such as fires, floods and cyclones threaten to impact a certain area (or already are). However, these embargoes can be across all forms of insurance as home, contents, motor, business and travel.

If an insurable risk is imminent, the probability of that risk occurring and therefore a claim being lodged is consequentially elevated. Insurers, operating prudentially, would need to calculate a premium that reflects this elevated risk, rather than averaging the risk over an entire year. This would typically make a risk based premium unaffordable to a homeowner.

Not all insurers impose embargoes.

Australia’s insurance market is large and highly competitive, and at any one time there are usually insurers who have not enacted an embargo.

How to avoid being caught out by an embargo?

Make sure you have insurance in place all the time. Ensure that your cover has been taken out well in advance of disaster season for your location and avoid allowing it to lapse. Summer is a big part of the disaster season here in Australia, generally speaking. We have most of our rainfall and bushfires in the summer months.

However, think about your location, for example the tropical North of Australia will have periods of high chance of increased rainfall (wet season) and cyclones (storm season). Toward the alpine areas of Australia, winter is also going to be a period concern with high snowfall.

Anyone in Melbourne should be on high alert ALL YEAR. On any given day it could be raining, sunny, windy, snowing, cyclonic, raining again, windy and cold.

As an example of what you can do to be more aware of these weather activities and potential embargoes, I was doing some research and came across a great website.

Early Warning Network Website

http://www.ewn.com.au/

Some of the services that they note on the website include:

  1. Location Based Warning Systems
  2. Local weather outlook
  3. Situation room
  4. National significant weather threat map
  5. Commercial location alerts
  6. Regional alerts
  7. Insurance embargoes
  8. API
  9. Flood monitoring and Warning

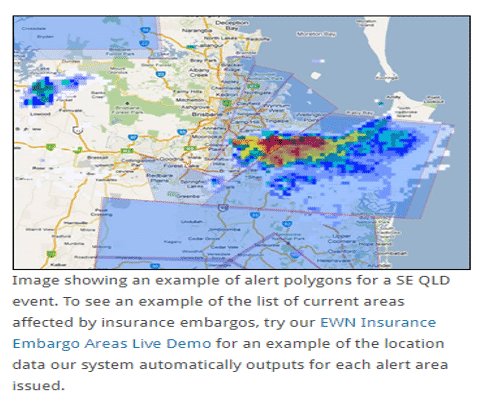
On the Early Warning Network website, it shows the areas where embargos are in place. As an example, it would look something like this.

1 - MCG Quantity Surveyors

In addition to this, I would suggest that using the ICA website is a good practice.

The Insurance Council of Australia has some great content on the website and will help you regarding finding an insurance underwriter that is willing to provide you cover even in an embargo.

In addition to this, they also provide data on the health and trends in the insurance market.

A snapshot of the Domestic Insurance Trends from 2002 Quarter 1 to 2019 Quarter 3, Is shown below:

2 - MCG Quantity Surveyors

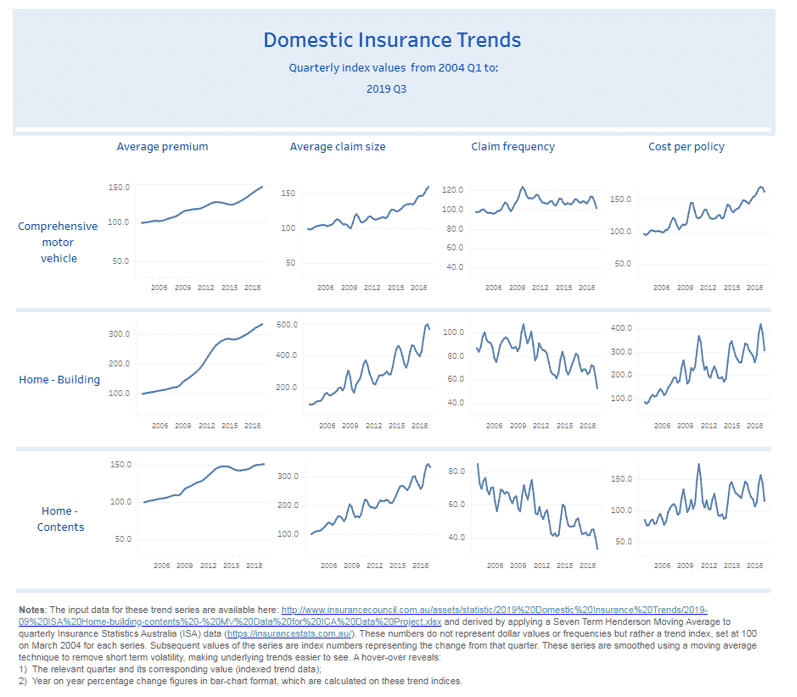
You can see the average claim size for ‘Home – Building’ has been steadily increasing from well below the $200,000 mark in 2004 to now well over the $600,000 mark in 2019.

Either our homes are getting more expensive to build, or more of the house is being impacted in the event, moving more toward total loss rather than partial damage.

The next graph along from that is the claim frequency, which will after the most recent events of bushfires and floods be taking a hike northward.

Since the 8th November 2019 through to now, a reported by the Insurance Council of Australia, some 13,750 bushfire insurance claims have been lodged, totalling damages of $1.34 billion.

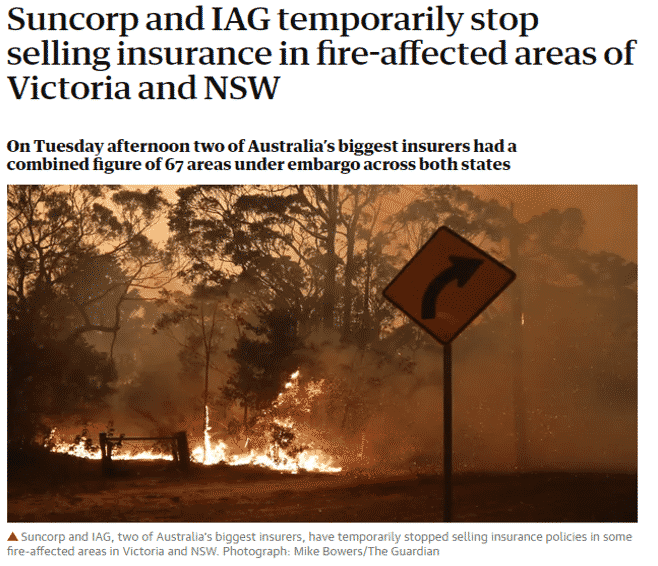
An article in the Guardian Newspaper as of around the 14th January 2019 this year, noted that both Suncorp and IAG, two of Australia’s biggest insurers had a combined 67 embargoed areas on their books.

4 - MCG Quantity Surveyors

I know I have been on my soapbox regarding underinsurance and inaccurate use of website calculators over the years, however, it seems that the industry just did not have a voice. It appears since my rants have become more public; the supporting voices are now coming out of the woodwork.

Like Jonathan Brown of the consumer group Choice.

“Like all insurance decisions, that’s entirely up to you. You need to carefully consider your own circumstances and look at independent advice beyond calculators provided by insurers and commercial brokers or websites”, says Jonathan Brown.

And now, even Campbell Fuller of the Insurance Council of Australia (ICA) has publicly announced on the ABC that:

“About 80% of insured property owners are probably under insured”, says Campbell Fuller of the ICA.

That was a direct quote from my last article on the inaccuracies of the online calculators within the industry. So, thank you, Mr Fuller.

For the residential property owner or homeowner, there is really two types of insurance that you can take out on your property.

  1. Total Replacement Cover, and
  2. Sum insured cover.

The sum insured value will cover you up to the set amount you choose to repair or rebuild your home.

So, in this circumstance, in my opinion, YOU MUST use the services of a quantity surveyor to determine what the rebuild cost will be.

However, Jonathan Brown of the consumer group Choice, further notes recently that:

“Some of the worst clauses allow insurers to base payouts on the rates they can purchase materials and labour at, rather than the actual cost of rebuilding or repairing your home”

“It may be worth considering a total replacement policy” Mr Brown says.

As I have said before, know your numbers. The fine print on policies do mean something and are worth your time.

Without being absolutely risk adverse on everything in life, I believe that from time to time, it is worth taking into account the worst that can happen in any particular scenario, then move backwards eliminating the risk or putting things in play to reduce the risk.

Let’s keep positive people, outstretch that arm and hand of your and help someone that could do with the help. It is not just property, lives and animals that were lost in the brutal bushfires recently. Communities have been as well. Let’s all do what we can. Travel to these affected areas, if nothing else, spend our money locally to them to help to rebuild these communities.

Are depreciation legislation changes affecting property investor behaviour?

Yes, yes they are. Or at least, it seems that way.

Now I’m tempted to just leave it there for my own amusement, but anyone that knows me will know I won’t be able to help myself in sharing the data I’ve crunched. Let me give you some background;

On the 9th of May 2017 the then Federal Treasurer and now Prime Minister, Scomo, announced that anyone purchasing established residential investment properties (i.e. not brand new) after that date would no longer be able to claim plant and equipment item deductions. Plant and equipment represent a big slice of the overall deductions, especially in the first five years of ownership. Generally, in the first full year of claim it’s more than half of the total deductions.

I’m a big believer in incentives. I believe that humans will naturally follow paths that they’re incentivised towards. So where are the incentives leading people? In my view, they’re clearly leading them to purchase new property.

If you buy a brand-new property that’s always rented out, you’re exempt from the changes. Meaning that you can not only claim all the available building structure deductions, but you can claim those juicy, high depreciation rate attracting plant items. Things like;

  • Kitchen Appliances
  • Blinds and Curtains
  • Hot Water Systems
  • Pumps
  • Ceiling Fans
  • Air Conditioning
  • Bathroom Accessories
  • Exhaust Fans
  • The list goes on

So, there’s your background, now what about the data? I have to be a little cagey I’m afraid as we’re about to share some of this industry first data in a press release and whitepaper, but I can tell you that between November 2017 and December 2019 investors buying a brand new property have increased by just shy of 45%. To me, that marks a sizable shift.

Now there may be several other reasons why this has happened. Perhaps there’s greater education on the benefits of new properties, perhaps our data which only really comes from investors obtaining schedules is a little too skewed. Although on the latter point, we’ve checked it against big data from mortgage aggregators and it’s pretty darn close.

What can we surmise from this? I think it’s a key indication that whenever the rules around property investing change to skew the advantages in any direction, investors will likely follow. Of course, there are way better reasons to buy one property over another than the tax advantages. However, but one should not underestimate the power of the fear of the stick and the pleasure derived from the carrot.

Mike Mortlock is a Quantity Surveyor and Managing Director of MCG Quantity Surveyors. MCG Specialise in Tax Depreciation Schedules and Construction Cost Estimating. You can visit them at www.mcgqs.com.au/


Case Studies – Estimating costs of our very own Australian Solar Farms

In May 2019, Giles Parkinson titled an article “It’s not easy to build a solar farm in Australia any more”.

This was published on the Renew Economy website on the 16th of May 2019.

Mr. Parkinson goes on to state that albeit in the past, the powers to be believed it was easier to build a solar farm than a wind farm. Why the belief was that they were quicker to build, fewer hassles around the development application process and much fewer objections from neighbours.

“In Queensland, a rule from left field, or more specifically from the Electrical Trades Union, means that no one is too sure when the next solar farm might begin construction. The new rules introduced this week by the Queensland Labor government, at the urging of the ETU, mean that only licensed electricians can do much of the installation work, and it has stunned the industry”, notes Mr. Parkinson.

In addition to the opinions expressed by Mr. Parkinson, it seems that contractors used to build these solar farms are feeling the pressure. Or at worst, collapsed them. In recent months we have seen the collapse of RCR Tomlinson, one of the country’s biggest engineering and contracting firms in the solar farm industry.

Likewise, Tempo Australia has felt the pressure and suspended shares from trade due to cost blowouts on a farm under construction in Victoria.

Given that prediction by the Clean Energy Council of 50% renewable targets, it is going to be a hard push without these major players completing these farms.

Mr. Parkinson goes on to note that Ekistica recently illustrated the marginal loss factor of the four energy sources (Fossil, Solar, Hydro and Wind).

The graph shows how many of the fuels are sitting around 95% to 98% of their output gets paid. Whereas solar is struggling to stay above the 90% mark.

Image 1 - MCG Quantity Surveyors

This output rating is provided by the Australian Energy Market Operator (AEMO). The Marginal loss factor is the amount of output that gets credited to receive revenue. Meaning, in 2019, solar is currently rating at 0.9. This means that the average solar farm is getting credit for around 90% of it output.

“One solar farm, in Broken Hill, has been marked down to 0.75, which means only 75 percent of its output gets paid”, said Mr. Parkinson.

CEO of the AEMO, Audry Zibelman, says that the AEMO is doing all that they can, citing a cultural shift yet to be embraced as a major roadblock.

But for many frustrated solar farm developers, it is not fast enough. “What we are going to see is a pause,” said Morgan Stanley analyst Rob Koh.

On the ARENA website (Australian Renewable Energy Agency) it states that the cost of a Large Scale Solar (LSS) farm in Australian to construct has dramatically fallen over the years.

“The cost of large-scale solar PV has fallen dramatically in recent years from $135 per megawatt-hour (MWh) in 2015 to an expected $44.50 – $61.50 per MWh in 2020.”

This reduction was driven by a combination of international and local improvements and is expected to continue. International cost drivers include the cost of manufacturing, and local costs include the cost of finance and construction.

A megawatt is a unit for measuring the power that is equivalent to one million watts. One megawatt is equivalent to the energy produced by 10 automobile engines. A megawatt-hour (Mwh) is equal to 1,000 Kilowatt-hours (Kwh). It is equal to 1,000 kilowatts of electricity used continuously for one hour.

Case Study 1 –

MCG Quantity Surveyors were recently commissioned to provide feasibility costing on a Large Scale Solar Farm in QLD. The total cost of the development came to $14,000,000.

The five-megawatt, 16,000-panel farm produces electricity that is fed back into the grid.

This Solar farm project costs total – $2.80 per watt.

Case Study 2 –

MCG Quantity Surveyors were recently commissioned to provide feasibility costing on a Large Scale Solar Farm in NSW. The total cost of the development came to $9,848,025.

The five-megawatt, 16,000-panel farm produces electricity that is fed back into the grid.

This Solar farm project costs total – $1.96 per watt.

Interestingly, FG Advisory has recently provided a report to the Victorian Greenhouse Advisory to indicate the average cost per watt for the construction of Large Scale Solar farms. They average the cost to be $2.41 per watt.

Image 2 - MCG Quantity Surveyors

In addition to this, the finding was based on reviewing 13 Large Scale Solar Farms, already constructed, they found the average to be $2.41 per watt.

Image 3 - MCG Quantity Surveyors

Written by Marty Sadlier
Founding Director and Owner at MCG Quantity Surveyors

Building approvals point to a potential future housing shortage

It doesn’t seem that long ago we were talking about an oversupply of apartments across Sydney, South Melbourne, and Brisbane. However, a lot has changed in the past few years. The ABS October figures on building approvals show a seasonally adjusted estimate for total dwelling units falling by 8.1% in October. The graph below from the October ’19 ABS figures paints a vivid picture of what’s been happening to approvals since 2018.

Building approvals point to a potential future housing shortage - MCG Quantity Surveyors

(Source: ABS 8731.0 – Building Approvals, Australia, Oct 2019)

The lag between rate cuts and building approvals grows ever larger and ANZ are claiming a potential future housing shortage. ANZ senior economist Felicity Emmett sees vacancy rates declining over 2020 and 2021 with approvals not picking up until mid-2020.

It sounds as though ANZ are not quite out on a limb, given that the Reserve Bank deputy governor Guy Debelle in fact considers a shortfall in housing supply as “quite likely,” with the end result being a “larger price response” in property values.

He further stated that “While the increase in supply has finally met the earlier increase in demand, demand will continue to grow given population growth, but supply is going to decline. So, there is quite likely to be a shortfall again in the foreseeable future.”

Higher density construction is subject to longer lead times, so the supply response is always going to be slow. This further exacerbates any potential supply issues on the horizon.

Construction activity has a solid impact on GDP and the CBA estimates that the full downturn would cost the economy 1.4 percentage points worth of overall growth.

The effect of tighter lending standards for developers is surely part of the puzzle, but it’s mixed in with a weaker demand from would-be purchasers over the last little while and some of the concerns over the quality of newly constructed apartments.

It seems that 24 months is a long time in construction and real estate, and the supply and demand fundamentals look to seesawing in the other direction. Along with the Government and RBA, we’ll be watching with keen interest.

Written by Mike Mortlock
Managing Director of MCG Quantity Surveyors

Wrapping up the year with Data, Dance Floors, and Depreciation

Our year started on a high, coming off the back of a massive win for MCG. Landing a position on the Financial Review’s top 100 of fastest-growing businesses, we hit the ground running!

Mike Mortlock and Mitch Ford completed their much-anticipated triathlon, with over $2k raised for Heartkids, a charity helping those affected by congenital heart disease.

Mike smashed it and beat Mitch in Foster, which was expected with the large amount of trash talk happening in the office leading up to the event. Overall, they both demolished their own expectations and there were smiles and heat rub creams all ‘round.

We then attended the Accounting Business Expo in Sydney, where we mingled with accountants and business pros alike. The event is always a great chance to present on stage and chat all things depreciation. We’ll be back next year, so keep an eye out.

During May the election came and went, which honestly feels like a whole two years ago and undoubtedly has me thinking how long this year really has been.

But the election provided great opportunity to get our data nerd hats on and didn’t we flourish, (our nerd hats are always on, let’s be honest). 

With the Labor Party pitching to abolish Negative Gearing if they were to win power, shadow treasurer Chris Bowen suggested that investors buying brand new comprised anywhere between 4 and 14 percent of the total numbers. Our ears pricked up and we analysed data going back to 2016, finding that 43 percent of our investor clients bought or built brand new housing. This data with additional evidence from mortgage aggregator AFG led to a more sophisticated debate based on accurate data, so we threw around a couple of high-fives in honor of this small win and the media covering the story with our industry-first data.

On top of the dampening effect on property that an election tends to have, APRA also made some tweaks to their investor requirements and serviceability floors. Combined with low-interest rates, the back end of the year saw an increase in housing activity and auction clearance rates.

(I’m still trying to work out why at this point, but some people on LinkedIn kept mentioning it, and Mike posted some videos too.)

In June, Director Marty Sadlier took on the cold weather in Sydney to help change the lives of Australians experiencing homelessness.  A record 7.9 million dollars were raised to help break the cycle, with some solid efforts from Marty raising much-needed funds as well. Marty also added ‘Social Media Specialist’ to his resume and was given unrestricted access to the MCG social media accounts. All 3 of his fans tuned in to get live updates on the event as Marty talked about how cold it was, as well as shedding some light on the significance of supporting Vinnies and Australians who are doing it tough. We’re very proud of Marty, and we are sure to see him again in his cardboard box in 2020.

The 1st of July saw the first real major changed to residential effective lives since 2004. It’s truly a moment of reflection on your interests when you can record a 3-minute video and a blog for API on carpet having a new effective life of 8 years.

New thresholds also came into play for businesses. Businesses with a turnover less than $50 million are now eligible for the instant asset write-off of $30,000 (depending on when you bought the asset).

Not content with our nerdy data analytics wins thus far, we dug into some more data and found that property investors not claiming deductions in a timely manner, are missing out on deductions of $20,537 on average.

And, if that wasn’t specific enough, if these results are extrapolated across the nation’s total investor population missing out on claims, (potentially 140,525) this equates to a total potential loss of $2,885,967,347 in missed depreciation overall. Yep, over 2 Billion Aussie dollars! That’s a hell of a lot that we could have had in our back pocket.

The last months of 2019 have flown by, which usually happens after tax time, it’s just all downhill from there. However, we attended some rather educational events, which allowed us to get out in the real world and show off our moves. I was using this metaphorically, but then I remembered our MCG team on the literal dance floor at the annual Bean Counters Charity Ball in October. A Depreciation and Estimating specialist that can dance is a real niche.
We spoke at the Real Estate Buyers Agents Association 2019 Conference, which draws Australia’s best and brightest property buyers together. Then backed it up with the first ANZ Property Investment Seminar, an informative chance for property investors to see the process from A – Z. Yep, all the way to the tax depreciation guy. 

Wrapping up a big year we had some more healthy exposure in the media, this time with Australian properties being underinsured. Marty brought out some new research showing that some homeowners could be underinsured by 66%, heightening the risk of financial losses as Australia launches into bushfire and flood season. Our analysis showed that property owners relying on web-based calculators by insurance companies could be finding themselves coming up short. Another win for our team, and more importantly Marty’s cost planning squad.

That’s about it from us in 2019, and if you’re still reading, we appreciate the support. We also wish you all the best as we head into the new decade, I’m sure it’s going to be a hoot! We look forward to bringing some more moves to the D-floor and some nerdier data stats.

Enjoy the festive season and stay safe. Our offices will only be closed on public holidays. Cheers!

Progress Claim Case Study – The MCG Method of Assessment

As part of the services of quantity surveyors, we are regularly commissioned to undertake progress claim assessments on behalf of financial institutions.

During the last month, we have seen quite a common conversation held between ourselves and a client (developer) regarding the difference between our assessment of the builders claim and the amount that the builder was claiming for.

It will be no surprise to many of you, our quantity surveyors assessment of the builders claimed amount was less than that claimed for by the builder.

Are we harsh, or is this a reflection of two different methods of assessment and claiming for works completed to site?

It is the latter.

In the scenarios that I am referring too last month, we had four (4) builders indicate to ourselves and the developer that they would be ceasing works on the site until there progress claim had been paid in full.

In these instances, the builders had submitted their progress claims as per the signed construction contracts, as Staged Progress Payments or Milestones.

These contracts were either Master Builders Association contracts (MBA) or Housing Industry Association contracts (HIA).

The builder will nominate percentage values to each of the stages, with a common break up being:

Deposit – 5 %

Base stage – 10 %

Frame stage – 15 %

Lock Up stage – 35 %

Fixing stage – 25 %

Completion – 10 %

Total – 100%

From the client or developer’s perspective, they had sought funds from a financer, which was based on the release of funds being assessed by a quantity surveyor and based on ‘works completed to site’.

In these four (4) scenarios, there were two (2) reasons for the difference in the assessment of the progress claim value.

The percentage nominated as being completed to site ‘Frame Stage’ was much higher than the value of the works completed to site.

Works had not been completed to site that fulfilled the definition of the milestone.

In the issues surrounding the overstated percentage for a particular milestone (Point 1), the percentage of the contract value that is claimed each time is not a reflection of the actual works completed to site. The builder will have increased the value of each of the stage percentages so that they can fund deposits and long-lead materials for the future works and stages. For example, with the 10% of the base stage funds claimed, so of those funds will be used for the securing of timber wall and roof frames deposits and window deposits.

The risk to the client is that in the event of the Builder or building company going under or leaving the project, there may or may not be enough funds left to successfully finish the project.

However noting this, the construction contract that notes milestones is still a legally binding document.

Therefore, in these cases, the discrepancy between the claimed amount and the assessed amount has forced the client to put their hand in their pocket to make up the difference between what the financier will pay and what is written in the building contract.

This shortfall of funds will take some time for the client to get to the builder, in turn, delaying the program by a few days.

With the scenario of point 2, although our assessment of the works was based on works completed to site, the client was not required to pay the builder any funds as they had not completed the works as defined in the contract as being required to fulfill the milestone.

The builder had claimed for ‘Fixing Stage’. The contract defined fixing stage as:

Fixing Stage – “means the stage when all internal cladding, architraves, skirting, doors, built-in shelves, baths, basins, troughs, sinks, cabinets and cupboards of home are fitted and fixed in position”.

However, freestanding baths had not been placed in position and basins had not been installed to the stone benchtops on some of the vanity units.

In this scenario, the builder really should have considered the types of fixings and fittings specified for the development and considered modifying the wording of the milestone or moving some of these items to the final stage definition.

It is no secret that obtaining finance is still a stumbling block for developers in the current economic climate, so our advice is that understanding the constraints and potential funding issues that a development may face is absolutely paramount.

New figures show the housing slowdown is biting NSW hard, with the number of construction companies going under last quarter hitting its highest level in almost four years.

Statistics provided by ASIC show 169 NSW-based construction companies went into administration, receivership or a court-ordered shutdown in the June quarter. This is the highest number since the September quarter of 2015.

Over the whole 2018-19 financial year, 556 construction companies went under — 101 more than the previous financial year.

Mr. Hathway, Association of Independent Insolvency Practitioners president and who also runs his liquidation firm, said small construction companies had been hit hardest.

Stephen Hathway said there was no doubt the industry was “stressed”. “These days it’s subcontractors on subcontractors,” he said.

“And the general feel I’m getting from talking to my fellow liquidators, is that in the building industry subbies just slow down paying the little ones (construction companies).

Sure, there are various reasons why construction companies fail. However, cash control and the timing of funds coming in are a major contributor to the issues.

Capture - MCG Quantity Surveyors

More and more reason to be fully aware of how funds are to be paid to you by either a developer or financier.

Understanding the potential pitfalls or bottlenecks pertaining to progress claim funding will allow builders and developers to avoid exposing themselves to these risks.

Written by Marty Sadlier.

Marty is a property investor, cost estimation specialist and Director of MCG Quantity Surveyors. His passion is ensuring that developers and investors alike gain a comprehensive understanding of all construction costs and potential risks on their developments. Marty’s mission is to assist property developers to achieve financial security through accurate construction consultancy services. You can visit them at www.mcgqs.com.au/

What you need to know about short term leasing your investment property


I’ll admit that I struggled with an appropriate title as the above one is certainly clunky, but I wanted to share some tips on how to rent your investment property out on a short-term basis, similar to an Airbnb type setup.

My pet subject is depreciation, so I’m not going to let you get away without reading some key issues about deductions and short-term rentals. However, I’ll start with the fun stuff.

The steps to making an investment available as a short-term rental

You can certainly manage this process and the leasing component of this yourself, but I’d be inclined to find someone to help you with this. As exciting as it might sound to become an Airbnb or short-term rental billionaire, you’re going to need to get your hands dirty. You’re going to need to field questions about, and handle much of the following items listed here which are not limited to;

  • Guest enquiries about potential bookings
  • Guest vetting to make sure they’re well behaved
  • Confirming bookings and collect accommodation payment and security deposits upfront
  • Check-ins and check-outs
  • Property maintenance
  • Professional cleaning after every check-out
  • Laundry and providing fresh hotel grade bed and bath linens
  • Restocking guest amenities e.g.; toiletries and cleaning products after each check-out

I’m certainly not trying to scare you off, but in my experience, these are the last things people think about when they’re in the exciting feasibility stage.

As for the steps to getting it online, you’re going to need to do the following;

  • Furnish the property
  • Dress the property with soft furnishings and artwork to make it stand out
  • List the property on all the major booking channels (which will require photography)
  • Design property manuals with instructions on how to use items at your property, tips on what to do in the area, property rules, and exit instructions. You’ll probably even need to buy a bloody laminator!


Short term rentals can be an awesome way to boost your rental yields, but the property needs to fit the demands of the location, and not all locations are certainly created equal. There are companies such as Quickstay, who specialise in Airbnb property management in Melbourne that can handle the whole thing for you and provide advice on whether your property is going to be a good fit. I should probably give them a plug anyway, lest they come after me for stealing some of their points from one of their articles!

Ok, now it’s time to eat your vegetables and read about the depreciation considerations. I promise you that you’ll learn something.


What you need to know about depreciation and short-term rentals

Short term rentals typically have great deductions because of the furniture provided. Sure, the original structure can qualify for division 43 deductions if the property was built after September ’87, but the plant and equipment items are the real kicker. It’s not just the loose assets like furniture we’re talking about either, it’s also the carpets, blinds, air conditioning and the like. However, due to the high rates of depreciation on the furniture items, they do give you a real boost.

However, it’s not always that simple. You see, in May 2017 the game really changed. If you purchased your investment property after that date, you’ll only be able to claim those juicy plant and equipment deductions if you bought the property brand new. Luckily though, there is still one way you can get those plant and equipment deductions for your furniture if you bought an established property after May 2017.

How can you claim plant and equipment deductions on furniture if you purchased after May ’17?

You get them by installing the furniture yourself. Now I don’t mean you physically get your Allen key out and put it together, or indeed physically place the lounge into the living room with your own personal brute strength and brawn. Technically all you need to do is buy the items brand new and install/have them installed into your income-producing property.

So long as you do that, you can claim the plant and equipment deductions on the furniture almost exactly as you used to in the good old pre ’17 days.

You may have noticed a few little choice definitions and italicised bits above. The first one was ‘income-producing property’. If you put new furniture into a property, you need to ensure that you don’t kill off the deductions by residing in the property. You can mess this up if you’re living in the property and you put the furniture in before you move out, and you can actually kill off the deductions if you stay in the property yourself in a way that the ATO considers more than ‘incidental or occasional use’. For example, the ATO states on holiday homes that;

“Spending a weekend in a holiday home or allowing relatives to stay for one weekend in the holiday home free of charge that is usually used for rent would generally be occasional use.”

So, it’s important to note that anything over and above that is going to likely result in the end of your depreciation claims.

Outside of the above, there are things you need to understand if you’re looking to rent your principal place of residence short term, but I’ll leave that for another article. I will say though, seek an accountant’s advice first.

Hopefully, this article gives you some tips to start you off in the right direction, but I’d certainly recommend speaking to your accountant and seeking the advice of an expert in short-term rentals. If you do decide to go down this path, best of luck and here’s hoping nobody pinches your spoons!

Aluminium Composite Cladding being used in Victoria

So on the ABC News website on the 16th July 2019, the headlines read “Flammable Cladding to be stripped from buildings under Victorian Government Plan”.

It was the words of the state political reporter Richard Willingham that echoed the announcement of the Victorian Premier Daniel Andrews plan to announce the $600 million package to fund the rectification works. How do they intend to fund this? well the plan is that $300 million will be funded directly from the state coffers. With the remaining half to be sought from the Commonwealth.

With some 500 buildings in Victoria requiring rectification works to be made safe, Canberra has responded to the call from the Victorian Government with a very clear ‘No’. Treasurer Josh Frydenburg stating that this problem was a state issue and that the Federal Government “Will not pick up the bill”.

In addition to the treasurer’s statement, when federal Industry Minister Karen Andrews was asked if Canberra would make a contribution. Ms. Andrews’s response was “The Commonwealth is not an ATM for the states. So no, this problem is of the state’s making and they need to step up and fix the problem and dig into their own pockets,”.

Marty image 1 300x42 - MCG Quantity Surveyors

The contingency from the Victorian Governments plan is to fund this shortfall via the way of increasing the building permit levies. The increased levies at this stage are to be sought from developments in excess of $800,000.

Regardless of the funnels that the funds will be sought, the question that requires an answer is a simple one. “What is the forecast cost of the rectification works? Is $600 million enough?”

Well, consumer advocate Anne Paten from the Victorian Building action believes the real cost was in the order of many, many billions.

Although the Victorian Government has announced a plan for 500 buildings, it seems that many buildings with rectification work required, will simply just miss out.

As of July 5th, the taskforce audit inspected 2,227 buildings and noted that:

  • 72 x rated extreme risk
  • 409 x rated high risk
  • 388 x rated moderate risk

By my calculations, that totals 869 buildings at moderate risk and above as at the 5th July 2019.

So even the Victorian Government by its own omissions are prepared to leave some 369 buildings untouched, without rectification.

In just the past fortnight, MCG Quantity Surveyors have been requested to provide costs to rectify, remove and replace at risk claddings from developments across Melbourne.

Marty image 2 300x38 - MCG Quantity Surveyors

Albeit the total m2 of cladding that has been required to be rectified, removed and replaced varies, it is the avg cost of this replacement that is important to us.

In my opinion, the cost of the rectification of the buildings at risk within Victoria alone is in line with the opinions expressed by consumer advocate Anne Paten from the Victorian Building action, “many, many billions”.

As you can clearly see from the table below, just the average of the last 4 developments indicate an average cost of $513.27 per square metre of product removed.

Marty image 2 - MCG Quantity Surveyors

This is a real concern, especially given the Victorian Governments current announcement of only funding 500 developments at risk.

In June 2017, it took 90 minutes for fire to race up 20 storeys within the Grenfell Tower, killing 72 people.

Grenfell Tower was covered in an Aluminium Composite Cladding.

This type of cladding consists of a layer of plastic sandwiched between two aluminum sheets.

The internal layer of the sandwich panel is usually made up of polyethylene (also called polyethylene). It is a high-density polyethylene or HDPE.

Dr. Kate Nguyen, who leads a fire and facade engineering group at RMIT University, explained the issue with the HDPE product is its “combustibility ratio”.

The ratio is calculated by dividing the amount of heat released from burning material by the amount of heat needed to ignite it. The higher the number, the more flammable the material.

To put this into perspective, if you had a house that was clad in Red oak, for instance, is pretty low: it has a combustibility ratio of 3.

However, at the other end of the scale is HDPE. Dr Nguyen states “The combustibility ratio of HDPE is 25.” The scary thing to note here is that HDPE, therefore, produces 25 times more heat than it takes to combust.

So why does fire spread so quickly when a building is clad in an Aluminium Composite Cladding?

Well, when the HDPE is on fire, “the solid plastic turns to liquid, so when HDPE melts, it will drip down.” Says Dr. Nguyen.

Not helping the issue is that aluminum is an excellent conductor of heat. So if the aluminum gets hot enough, it will transfer that heat into the HDPE underneath.

As any firefighter will tell you, fire LOVES oxygen. Oxygen will accelerate the combustion of materials when alight.

Given that the aluminum composite cladding is fixed to the external of these building by way of a steel furring channel, or ‘top hat’ section, this construction technique provided a cavity behind the cladding and the internal framework of the building.

“These cavities funnel heat and smoke up the outside of a building “like a chimney”, Dr Nguyen said.

So a fire starting within aluminum composite cladding on any given floor of a building can spread in all directions, FAST.

  1. Upwards due to the flames and smoke in cavities;
  2. Downwards due to liquid HDPE ignites more HDPE as it drips down; and
  3. Sideways, as the aluminum spreads and transfers the heat.

Marty Sadlier is a founding director of MCG Quantity Surveyors and a member of the Royal Institute of Chartered Surveyors (RICS). Marty’s advice is regularly sought as an accredited expert witness and he sits on the interview panel for the Australian Institute of Quantity Surveyors (AIQS).

The ever-changing demographics that drive smart investment decisions

Those who know me, know I don’t mind a chat. Whiling away my time via the exchange of ideas is a joy. Best of all, it’s a move out of my professional comfort zone – a chance to expand the mind beyond ‘rates per square metre’ and legislative minutia.

Economists, builders, buyer’s agents and investment advisors are always great company, but everyday property investors are the real deal – these are folk making it happen!

They’re an adaptable lot too. Finding imaginative ways to invest in the right assets within their personal budgetary constraints and with a long-term view of where they’d like to be come retirement.

One knowledge area where smart investors like to stay out front is the study of demographics. By staying abreast of new information, they can seek holding what appeals to the widest range of potential tenant types.

Well, a recently released set of numbers is helping unearth the way we’re evolving as a population, and the industry participants I talk with tell me these demographic shifts are reshaping our housing types.

The changing face of Australia

The Australian Bureau of Statistics (ABS) released Australian Historical Population Statistics, 2016 earlier this year. The study compared the population’s composition from Federation in 1901 through to 2016. While it’s a wide time range, it does show how much incremental changes have evolved to create our modern population makeup.

In short, contemporary Australians are older, are more likely to live in urban areas, have fewer children and are more likely to be born overseas in countries outside of the British Isles.

Here are some of the interesting numbers from the study:

  • From 2001 to 2016, Australia’s population increased by just over 25 per cent to reach 24 million.
  • Overseas migration is now the main driver of Australia’s population growth, accounting for just over 55 per cent of the nation’s population increase since 2001.
  • Around Federation, the median age was 22 years, with just four per cent of the population aged 65 or over. In 2016, the median was 37 years, and 15 per cent of the population were aged 65 and over.
  • Since the first decade of the 1900s, life expectancy at birth in Australia has steadily increased by around 25 years for males and 26 years for females. By 2016, male life expectancy hit 80 years, while females can expect to live 85 years, ranking Australian life expectancy amongst the highest in the world.
  • In 2016, almost 30% of Australians were born overseas.
  • The numbers also confirmed our run to major cities with almost 90 per cent of the country living in urban areas in 2016.

Tasty graphics

The Australian Institute of Family Studies (AIFS) is a Federal Government body who’ve provided some interesting insights on the ABS study.

I’ve pulled a few graphics from their website to help illustrate the changes.

According to the AIFS, the proportion of family households has been declining. In 2016, families made up 71 per cent of Australia’s households, but in 1986 their proportion was 77 per cent. Over this same period, the number of single-person households increased from 19 per cent of all households to 24 per cent.

Households are getting smaller as well. In 1911, the average number of people per household was 4.5, but by 2016, that number had fallen dramatically to 2.6.

Image 1 300x131 - MCG Quantity Surveyors

Source: Australian Institute of Family Studies

From 1976 to 2016, there’s been a rise in the number of households comprising couples with no kids. In 1976, couples with children comprised 48 per cent of families, but by 2016, this had gone down to 37 per cent.

Image 2 270x300 - MCG Quantity Surveyors

Source: Australian Institute of Family Studies

Couples are also having fewer children. In 1961 the fertility rate was 3.55, but by 2012 it had dropped to 1.93.

At the same time, the percentage of couples without children increased from 28 per cent in 1976 to 38 per cent in 2016.

In addition, 6.5% of families were single-parent families in 1976, but by 2016 they comprised 10.2 per cent of families.

Image 3 300x137 - MCG Quantity Surveyors

Source: Australian Institute of Family Studies

There’s also been an increase in extended family members cohabitating. According to the 2016 Census, 8.3 per cent of households contained extended family members like a couple or one-parent family living with other relatives such as parents and grandparents.

What to make of this?

Casting an eye back over these stats you can see we are getting older (sorry folks – it’s a simple fact) but are healthier in our advanced years – so more likely to travel or enjoy lifestyle benefits of where we live.

Our family make ups have broken beyond the nuclear unit of ‘mum, dad, and 2.5 kids’ to become couples without kids, single parents and multi-generational households.

Our immigrant population has also created cultural diversities in our major population centres as well.

From what I can see, landlords looking to build a portfolio that will attract and keep tenants need to be thinking beyond traditional lines. They must deep dive into the tenant makeup of their areas of interest and consider ways to appeal to this new Aussie population.

Could it be adapting a home with multiple living spaces for parents, adult kids, and the grandparent? Might it be reducing floor areas and using clever design to bring in one-person, or childless couple, households? Perhaps locations with excellent schooling options are in dire need of more options for single-parent households – like a low-maintenance property with good security perhaps? How about designs that will allow our aging, but relatively healthy, elder Aussies to lock-and-leave as they jet off and discover the world.

Now, more than ever before, investors who can flex their thinking and meet the needs of changing demographics are set to create a secure property portfolio income.

What you need to know about under-insurance & online calculators

In 2004, consumers responding to ASIC’s ACT bushfire survey, 2004, found that the level of under-insurance in Australia is high. Data collected found that in Australia:

  • Between 27% and 81% of consumers were underinsured by 10% or more
  • In 2005, the Australian Securities & Investments Commission, issued a report titled “Getting Home Insurance Right”. Within this report, ASIC concluded that many insurers now help consumers estimate rebuilding costs by using web-based calculators.
  • The report went on to Road Test these web-based calculators, to see how accurate and similar they were to each other.
  • ASIC reviewed the calculators offered by nine major insurers in the course of this report, and compared figures they produced for the sum insured for five different properties.
  • ASIC found that there were significant inconsistencies in the figures generated by these web-based calculators. The largest gap recorded was some 125% between the lowest and highest estimate.
  • In other words the highest estimate was more than two times the lowest estimate for the same house in the same location.

Online Calculators 300x91 - MCG Quantity Surveyors

In 2006, two major insurers independently estimated that around:

  • 15% of households do not have home building insurance

In 2007, CPR Insurance Services, finalised a report based on CGU insurance that found:

  • 83% of businesses have inadequate building insurance
  • 15% do not adequately insure Plant & Machinery
  • Many Businesses fail to take into account their fixtures and fittings, particularly when updating them

In 2012, Life Insurance Finder, noted that under-insurance is common in Australia. It concluded that:

  • Australia belonged to one of the most under-insured nations
  • Surveys and studies have shown that a great number of Australians have insufficient cover whether it is home, business, or life insurance
  • It found that parents with dependents under them are surprisingly underinsured by $1.30 trillion – such a staggering figure.
  • The area of Home Contents/Building insurance where under-insurance occurred was a staggering 77%

Posted by Canstar Research on 04/01/2013

e Insurance Council of Australia estimates that more than 40% of households fail to correctly assess the value of their home.