Bushfires & Floods – The cost of a Natural Disaster to home owners

Australian Research

In 2000, the Construction Data division of Reed Business Information Systems (Reed) surveyed 1000 randomly selected homeowners. They concluded that:

  • 87% of homes were under-insured by any amount
  • The average level of under-insurance was 34%

In 2002, the Insurance Council of Australia conducted a survey of seven companies sharing 80% of the home building insurance market. The survey suggested that:

  • 5% of homes were under-insured by 10% or more, and
  • 5% of home buildings were under-insured by 30% or more

In 2003, the Royal Automobile Club of Victoria (RACV) found that consumers do not increase the sum insured following improvements to their homes. The survey found:

  • 24% of consumers did not increase the level of cover after renovations costing between $20,000 and $40,000.

In 2003, bush fires caused death, injury and destruction of property in the ACT. A total of 488 homes in and around Canberra were destroyed.

However, many insured homeowners found that their building insurance policies did not meet the full cost of rebuilding their home and associated expenses. They found, they were underinsured.

The Insurance Disaster Response Organisation reported that structures destroyed in the ACT bushfires were underinsured, on average, by 40% of the replacement cost.

Respondents to ASIC’s ACT bushfire survey were asked how the sum insured under their home building policy was initially calculated. The results found:

  • 51% estimated the sum insured themselves
  • 23% reported using information from an insurer to help them
  • 80% saying they believed they were adequately insured


Queensland Floods

On the 11th January 2011, the then premier of Queensland, Anna Bligh, declared three quarters of Queensland a disaster zone as the State was affected by one of the most severe flooding events in its history.

About 15,000 properties were affected by significant flooding, with 5,000 businesses affected. In Ipswich a further 3,000 homes and businesses have been flooded. The Local Government Association of Queensland estimates that 70,000 to 90,000 km of council roads have been damaged (councils are responsible for 80% of roads).

IBIS World also expects approximately $1 billion to $2 billion in additional spending on commercial and institutional premises would be needed in the following 2 years of the event. The damage to these buildings was partly contained by greater use of concrete and steel, as distinct from the timber and plasterboard of most residential housing.

However the Reconstruction cost was estimated at some $10 billion. (Jan 2011 IBIS World)

The Queensland floods were followed by the 2011 Victorian floods which saw more than fifty communities in western and central Victoria also grapple with significant flooding.


Victorian Floods

It was recorded that high intensity rainfall between the 12th –14th January 2011 caused major flooding across much of the western and central parts of Victoria.

This, along with follow-up heavy rainfall from events such as Tropical Low Yasi, caused repeated flash flooding in affected areas in early February in many of the communities affected by January’s floods.

As at the 18th January, more than:

  • 51 communities had been affected by the floods
  • Over 1,730 properties had been flooded
  • Over 17,000 homes lost their electricity supply.
  • 51,700 hectares of pasture and 41,200 hectares of field crops flooded
  • 6,106 sheep were estimated to have been killed

The Department of Primary Industries later calculated a damage bill of up to $2 billion.


New South Wales Bushfires

The New South Wales Rural Fire Service notes that the 2012-2013 Christmas period witnessed large parts of NSW  affected by bush fires brought on by searing temperatures and wild winds.

The RFS has confirmed 33 properties and more than 50 sheds have been destroyed, as well as machinery and there have been extensive stock losses in the bush fire west of Coonabarabran, which also damaged the Siding Spring Observatory. The fire in the Warrumbungle National Park in the north-west of the state had burnt out nearly 40,000 hectares and has a 100-kilometre-wide front.

More than 170 fires continued to burn across the state at that time

In Tasmania, a Victorian fire fighter had died while fighting bush fires that have destroyed about 170 properties.

Recent Disasters Table

Recent Natural Disaster Total Cost
QLD Cyclone YASI  $            1,412,239,000.00
QLD Flooding  $            2,387,624,000.00
SW QLD Border Flooding  $               131,432,000.00
NSW & VIC Flooding  $               131,890,000.00
VIC Flooding  $               126,495,000.00
VIC Christmas Day Storms  $               728,640,000.00
VIC Severe Storms  $               487,615,000.00
WA Perth Bushfires  $                 35,128,000.00
WA Margaret River Bushfires  $                 53,450,000.00
Tasmanian Bushfires  $                 86,700,000.00
NSW bushfires (Coonabarabran region)  $                 12,000,000.00
Total  $            5,593,213,000.00


Quantity Surveyors – accurate replacement costs of your development

In a recent review for a client on their building insurance, our client witnessed first hand how easy it is to be under insured.

In this instance, our client owned a 2,850 m2 industrial building in the north-west of Melbourne VIC.

It was constructed of precast concrete walls to a height of 1800mm high to the external walls, then the remaining upper portion of the walls was metal clad. The roof was steel portal frame and steel sheeting.  A small internal office and mezzanine level was also present. The external car parking or hard stand area was a concrete slab on ground with storm water pits and small portions of kerb and guttering.

The current insured sum was provided to us by the owner as being made up of:

Table 1 300x56 - MCG Quantity Surveyors

The owner was unaware of the total square metres of the development at this time.

We conducted a site inspection and measured up the size of the development as plans were not available.

In summary, it was our opinion that the development was currently under-insured. Upon completion of our report, we estimated the replacement cost of the contraction of the warehouse and the car park to be in the order of:

Table 2 300x67 - MCG Quantity Surveyors

In addition to this, we also noted to the client that allowances for time escalations must be included in the replacement value of the development. We provided the following time escalations to the development.

Table 3 300x78 - MCG Quantity Surveyors

Once we add the constructions costs and the escalations together, you can see that the existing insurance replacement cost of $1,321,750 was grossly under insured.

Table 4 300x90 - MCG Quantity Surveyors

It was our recommendation to the client that the industrial warehouse be insured for $3,113,388 exclusive of GST.

Unfortunately, we see this under insurance all to often and hope that these examples can highlight the importance of having your property assessed by a qualified Quantity Surveyor to accurately determine the actual replacement cost of your development.

What sort of tax deductions will a swimming pool give you?

Swimming pools and depreciation – What sort of tax deductions will a swimming pool give you?

It’s not unheard of for an investment property to have a swimming pool, certainly a shared one as part of the common areas of a larger unit development is very common. However, residential houses with swimming pools aren’t terribly common due to the costs of maintenance, compliance issues with fences and the like. I’ve never heard of an investor installing one for a tenant, but certainly, plenty of investors buy properties with one already in place. This is especially the case when the investor has a view to occupying the property themselves down the track.
So, if you are looking to purchase or have purchased an investment property with a swimming pool, what sort of deductions are you looking at?

You’re going to hate me, (presumably we’ve not already met for you to hold that opinion already), but there are a lot of variables here. Let’s look at the most obvious one, that being the breakup between the plant and equipment component and the structure component.
Within a swimming pool, there are only a few items that are listed as plant and equipment within the legislation.
These are mostly, but not limited to;
• Swimming Pool Chlorinators & Filtration Assets
• Heaters (electric, gas or solar)
• Cleaners

Yes, there’s also swimming pool covers and potential spa pumps and the like but it’s mostly going to be the filter and any automated cleaner devices.
The good news is that these items depreciate at much faster rates to the pool itself, anywhere from 10% to 28.6% under the diminishing value method in general.
The bad news is that since 2017, to claim these plant items you either need to buy the property as brand new or add these assets to the rental property yourself. Consequently, most investors aren’t likely to be able to claim the assets at all. Still, for the sake of argument, we’ll analyse the deductions on them anyway.

The good news is that MOST of the value of a pool is in the division 43 capital improvement category. So, if it’s a concrete pool, it’s all the concreting as well as the pool fencing, tiling etc. It’s the highest component of total value, but we’re talking a flat percentage of 2.5% per annum for 40 years from the date of installation. What’s positive though is that you don’t have to build the pool yourself or buy it in a brand-new property. The changes to plant items in 2017 don’t impact structural deductions so it’s fine to claim if it was installed after the cut-off date for division 43 allowances.

Enough legislation I’m sure you’re thinking, show me the deductions!

Swimming pools 300x57 - MCG Quantity Surveyors

Swimming pools - MCG Quantity Surveyors

Of course, this is contingent on the value of the pool, but I’ve gone with a pretty standard concrete construction here at $50,000 in total, with some limited plant items. As you can see though, over $3,400 worth of deductions within the first full year alone if you purchase a new property with a pool or install it into your rental property yourself, which is nothing to sneeze at. If this property was one year old at the time of purchase, the deductions would drop to $2,236 as per the division 43 deductions only.

I hope that provides a guide as to the potential deductions, but as always, the decision to install one or buy a property with one in place should not be made on the deductions alone. There are several key considerations both positive and negative when you own a property with a pool. Still, if you do put one in, drinks at yours this summer?

Most common building defects in residential multi-owned properties

In a recent research paper pertaining to the examination of building defects in residential multi owned properties, there has been some great findings. These findings were authored by Nicole Johnston (Deakin University) and with Sacha Reid (Griffith University).
In summary, two studies have been undertaken to identify the most common building defects in residential multi-owned properties. The studies were both conducted by the same group of researchers (Easthope, Randolph and Judd).
The first study conducted in 2009 found that the most common defects identified by lot owners were water ingress, internal and external wall cracking, roofing and guttering problems and tiling faults.
In 2012, anchored off the original study, the researchers surveyed a larger owner cohort where respondents identified water leaks (42%), internal and external wall cracking (42%), exterior water penetration (40%), guttering problems (25%), defective roof coverings (23%), plumbing faults (22%), and tiling related defects (20%).

In the interest of endeavouring to find out why these defects are ever present; attempts have been made by the researchers to identify the stages (in development) in which defects arise.
Interestingly, and of a surprise to me, the study showed that 50% to 60% of building defects are attributed to design issues and would have been preventable with better design. Therefore, concluding that some 40% to 50% of defects arise in the construction phase.
Furthermore, of the percentage of defects that were attributed to the findings, some 32% originated in the earlier phases of development (including design), approximately 45% originated on site and remaining approximate 20% related to materials and machines.
It appears that data was collated from various building consultants and auditing companies, with the breakup of theses providers noted as follows; some 99 x report providers from NSW, 66 x report providers from QLD and 47 x report providers from VIC.
Similarly, an additional method of further drilling down to gain a deeper understanding of the prevalence of these defects was to interview these stakeholders. With some 21 interviews conducted across the 3 states, with a guide provided to them with the questions based on review of the literature. Of these 21 interviewees, lawyers and committee members made up 12.
In the process of the data collection, and by a way of summarising the findings, it was noted that many of the interviewees suggested that human error played a significant part in the building defects. This human error was largely summarised as misuse of building products (due to lack of knowledge), poor workmanship, time pressures (cutting corners), poor supervision, lack of training, lack of licensing and trade accountability.

Having noted this, further observations (mainly two recurring observations) were made by the interviewees regarding organisations factors that contributed to building defects and the prevalence of the building defects. The first recurring observation was the motivation to make a profit and the second was time pressures that resulted in mismanaged process time allocation and co-ordination of trades.
When questioning surrounding the use of Private Certifiers was raised and if Private certification systems were flawed, the general consensus of the 12 x lawyers and committee members was that the system was deeply flawed, with committee members raising more pointed concerns that the private certifying system was not only conflicted in their interests but their documents were at times fraudulent.
In what I found to be staggering, one of the interviewees, a private certifier, noted that “it is not feasible to inspect every element of the building either before or after construction”. With the certifier adding “Responsibility must be on all those involved in the building process”.

An Expert Witness Case Study – Owner V Builder, August 2019

In a recent expert witness case that I was asked to provide my opinion of costs on, the result has now been published.

Background
The background to both applications is best described as:
The Owners’ sought damages from the Builder in respect of:
o (Item 1) Defective and/or incomplete works (the Defects Claim);
o (Item 2) Delay (the Delay Claim); and
o (Item 3) Breach of contract giving rise to excessive costs being charged (the Costs Claim).

The Builder’s response (in summary:

o Of the Owners’ defects claim, the Builder accepted liability for $26,830.78 of defects.
o The builder offered to settle the Defects Claim for $30,000.

To aid the tribunal in them being able to resolve the dispute, 4 x expert witnesses were appointed, one being myself (engaged by the Builder).
Item 1 – As a result of a conclave of experts, the Defects Claim was reduced to $67,983.83. However, of these defects, some were still in dispute as to if they were in fact a defect or not (8 in dispute).

At the beginning of the hearing, eight items in the Scott Schedule remained in dispute. During the hearing the parties reached agreement on four of the disputed items, and the claim in respect of the remaining items in dispute was determined.


Conclusion

Item 1 – The Owners were awarded damages in respect of agreed defects and damages in respect of one of disputed items.
Item 2 – The Delay Claim was wholly successful.
Item 3 – The Costs Claim was wholly unsuccessful.

Tribunal Orders
The Tribunal relevantly made the following orders:
o The Builder was to pay the Owners the sum of $31,255.73 immediately.

In hindsight, the builder had provided a reasonable offer prior to any court proceedings starting.
In the words of the tribunal, pertaining to the builder’s original offer of $30,000:
“This represented a genuine offer of compromise. The offer was open for a reasonable period and it was unreasonable of the Owners not to accept it.”

In closing the tribunal also noted:
“In my view, both parties had a substantial degree of success in the proceedings. The proceedings therefore had a mixed result. I am satisfied that the proper exercise of the costs discretion in this case is for each party to pay their own costs.”

It is therefore, in my opinion, if the original offer was in fact accepted by the owners, many hundreds of thousands of dollars of legal fees would have not been incurred by either party.
In addition to the extraordinarily high legal fees that both parties experienced, this matter took several years to come to finality.

Deductions & Depreciation for all – Why the kids are doing OK

Like any good analytical thinker, I love to hypothesise.
Some think it’s a character flaw, whereas I – and those of my quantity surveying ilk – enjoy nothing more than ingesting data, extrapolating the assumptions and producing a conclusion.

I was thinking about the recent federal election and the discussions put forward pre-poll day about who gets what benefits from which particular political party. It got me wondering about how we all make gross generalisations on which particular demographic gains most from depreciation tax breaks in the real estate sector.

Like most pundits, I always assumed those property owners who earn the most money – i.e. aged 45+ and on a high average income – were the mob reeling in the best benefits courtesy of the ATO.
It seems logical, doesn’t it? If you’re at the higher marginal tax rates, surely any hand back of taxable income you receive via government rules is working in your favour?
Well, like any decent political thriller, it turns out the truth is more complex than it may first appear.

I ran some numbers and here’s what they told me:

Depreciation for all
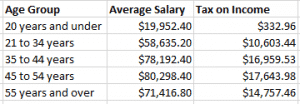
Firstly, I checked with the ABS to find out the average salary of several age groups as at May 2018 and looked at the tax applied to those incomes as per ATO guidelines.

ALL EMPLOYEES, Average weekly total cash earnings, Number of employees – Age category, May 2018

Blog 1 300x104 - MCG Quantity Surveyors

For the sake of the argument, I’m obviously excluding all those annoying extras that one might apply in deductions for work and other investments. Forget the nuances people, this is pure analytics of the highest order!
As you can see, it’s a reasonable spread of incomes across the age brackets from $19,952 to $80,298.
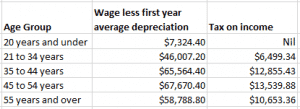
The next step was to study the average financial advantage to each age bracket of owning an investment, as opposed to not having an investment, based on the first year’s average depreciation.
For the sake of consistency, I chose a brand-new investment unit as the lynchpin investment. Units of this type are a popular and effective option for many buyers who use depreciation to their advantage.

I looked at average annual wage less the depreciation benefit from owning this hypothetical unit in the first year alone, and then calculated the resultant tax payable for each age group.

Blog 2 300x109 - MCG Quantity Surveyors

Finally, I observed the difference in tax payable (or ‘the advantage’) between those with the investment and those without an investment property in the first year across each age group.

Blog 3 - MCG Quantity Surveyors


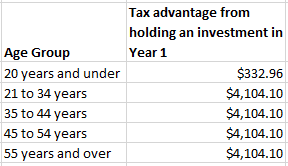
Blowing up the beliefs
The outcome was pretty revealing. My figures showed preconceptions around depreciation only benefiting high-income earners are not true. Whether you’re an average 22-year-old or an average 45-year-old, if you buy a brand-new unit, you’re still going to save the same dollar amount in tax each year.

Here’s another golden nugget of positivity for the youngsters:
• Based on these average figures, if you are 20 years old or under, own no investment property and earn an average wage, you will pay tax.
• If you are that same person, but hold one investment property, you will pay no tax.

That’s right – in your early years, an investment property makes you a ‘tax-free’ entity. Not a bad start for the young whippersnappers!
This outcome stems from the interrelationship between Australian tax rates and the nation’s average incomes.
So, as you can see, the idea depreciation only benefits the wealthiest of investors by age is patently untrue.

Now, who among you would have expected me to uncover this sort of egalitarianism when the exercise began? Certainly, among my crew, the expectations were that ATO rules meant wealthy 50-year-olds make a fortune at the expense of the younger cohort. But it turns out, everyone is on a pretty even keel.

So, at the next family barbeque when your anti-investment Uncle Bill raises an eyebrow about “fat cat baby boomer investors” who make fast money from depreciations, consider batting away his wayward generalisations with a little MCGQS science. And while you’re at it, ask your younger cousin Bella why she hasn’t considered getting into the market herself.
Turns out the young do enjoy a raft of advantages – plenty of time, enviable good looks and comparable tax breaks.

What the 2019 Federal Election result means for property investors

This question will be sliced and diced a million different ways over the next week or two, but I wanted to give you my thoughts on it.

In the short term, it’s going to provide a lot more certainty, and it will be back to business as usual eventually. A lot of investors and even prospective homeowners were sitting on their hands patiently waiting to see the results of the election. A Labor Government would have likely resulted in a boost in investor activity prior to the 1st of January 2020 when their capital gains tax and negative gearing policies were to be implemented. My view is that they were never likely to get the legislation through the Senate, but investors would have been looking to lock in a grandfathered property regardless. However, all this was prefaced on the idea that they could get finance. For investors especially, this was likely to dampen what should have been a very busy period for investors, followed by a short period of tumbleweeds invading open homes.

With the Liberal Government holding onto power, there’s much more certainty in the property market. Not just because the sweeping tax changes won’t come to pass, but also because those changes would have had somewhat unpredictable impacts on prices. In my view, property prices would have softened under Labor while rents rose as supply dried up, but nobody could have really predicted the impact of a brand-new property losing its’ advantageous tax status when sold to the next owner. A brand-new property would have been eligible for the CGT discount, negative gearing and full depreciation benefits rather than just the division 43 structural component. A valuer would have to take into consideration the fact that a new owner would incur much higher costs to hold that asset without the tax concessions, effectively lowering the value of the property.

If the election showed anything, it was that investors and small business owners don’t like being labeled as the ‘top end of town’, which makes perfect sense when you take a good look at the stats on the average investor. The idea that first homeowners were being shut down by swathes of investors purchasing their 5th, 6th or 30th property was shut down with ruthless efficiency. The tax policies relied on some dodgy data, which cost the Labor party some ground in the first week of the campaign. It begs the question whether the potential impacts of the proposals were fully understood by the party. Post-election night, Labor party leadership challengers were quick to distance themselves from the sweeping proposed tax changes, and party insiders’ question whether Chris Bowen is too damaged by his close association with the tax and franking credit policies to lead the party to the next election. Anthony Albanese stated that Labor would revert to a “blank slate” on its policies which may see Labor going to the polls next time around without their CGT and negative gearing policies which would be good news for the property market. APRA have shown that they’re more than capable of curbing investor activity and tax changes aren’t needed to slow investor activity.

The election also showed that Australia demands more action on climate change. One wonders whether the Labor party would have been in front with this message alone should they have been less aggressive on the tax reform front. Tony Abbott’s exit is an interesting development and hopefully provides more scope for the Prime Minister to implement policy on climate action, as the country, including a few newly elected independents, are going to be demanding it.

Property economists are now likely to be more certain in their calling of the bottom of the property market, and the single biggest property price appreciation headwind in my view is now the availability of finance. The 7.25 percent stress test and serviceability requirements will need to soften for any real booms to materialise within the next few years.

5 Hot tips on how to renovate your investment property – properly.

If you are renovating your investment property, make sure you get the most out of your hard toil. There are some simple choices according to MCG Quantity Surveyors, that can boost your bank balance without any extra work.

Mike Mortlock, managing director of MCG Quantity Surveyors, said many renovators don’t realise their choices of fixtures, fittings and materials will ultimately affect the size of their annual tax return. “Most renovators try and save money by tackling DIY work, but there are smarter ways to increase your result without additional hard labour,” he said.

Tip 1: Kitchens not bathrooms
Choosing to spend more in the cooking area will improve your tax outcome, according to Mr Mortlock.

“Kitchen renovations attract higher depreciation rates than bathrooms because of the sheer quantity of assets defined as plant and equipment items – the very things that depreciate fastest under the ATO (Australian Taxation Office) guidelines.”

Mr Mortlock said all kitchen appliances are plant and equipment, whereas within the bathroom space, there’s limited similar items, like bathroom accessories and exhaust fans.

Tip 2: Carpet not tile
Mr Mortlock said some floor finishes have greater tax advantages than others. “My tip for getting dollars back is to pick floating timber or carpet, rather than tile or polished concrete.”

He said in the eyes of the ATO, carpet has a 10-year effective life and floating timber has a 15-year horizon, while tile and concrete are both classified as lasting 40 years.

Tip 3: Small fixtures
Mr Mortlock said individual plant items with an opening value under $301 provide an instant deduction on your tax return.

“If, for example, you’re considering cost-effective approaches to cooling rooms, ceiling fans could be the way to go. If you have one installed for $300 or less, you’ll get a $300 deduction right away.”

Tip 4: Outdoor areas
Upgrading outdoor spaces provides the perfect opportunity to increase your tax return, said Mr Mortlock.

“You might consider making your rental more inviting by including a few little outdoor extras that provide great advantages for maximising rebates. External fridges and barbecues, for example, help improve rental appeal while also providing excellent short-term tax deductions.

Tip 5: Windows
Mr Mortlock said one of the most cost-effective ways to boost a property’s value and take advantage of depreciation is to include window coverings.

“They help with temperature control and filtering light, while also completing the property’s fresh, new look – and they’re a terrific tax deduction too.”

MCG insights into property investor behaviour that you need to know

Since we started preparing depreciation reports for property investors back in 2011, I wanted to collect data that I thought would illuminate the property industry as to the types of acquisitions the average property investors was making. Through the course of doing what we do, we also have to ask some fairly unusual questions that are pretty specific to our reports, but these questions can shed some light into investor behaviour as well. Most notably, our findings on investors living in their property prior to renting it out (https://www.realestate.com.au/news/1-in-5-firsttime-landlords-are-accidental-investors/)

Let’s look at some of the top-level data we’ve collected. Through our analysis of 1,000 residential depreciation schedules, we found that property investors are split across each type of residential property in the following way;
* 43.1% of investors either buy or build a house
* 8.5% on investors purchase a townhouse or duplex
* 47.3% of investors purchase a unit
* 38.2% of all investors buy something brand new

So, if you add townhouses and duplexes into the ‘house bucket,’ you’ll see that it’s a fairly even split. Now that we’ve identified the split, we’ll be tracking the numbers with interest.
If we dive into units individually, we’ve found that;
* The average number of units within the development investors are purchasing in is 68
* The average purchase price for investment units across the 473 units studied was $539,570
* 43% of units are bought brand new compared to only 26.2% of housing being bought new. This figure for houses drops to 7.3% if we exclude investors who engage a builder directly.

Clearly, we’re seeing the prevalence of off-the-plan purchases here and it will be interesting to see how these purchase prices hold up over time.

Now let’s look at some average deductions. In our research, we found the average depreciation deduction within the first full year of claim was $9,415. According to the ATO tax calculator, this gives you the following back in your pocket;
• On a $200,000 salary, you’ll receive $4,237 back in your pocket
• On $100,000 you’ll receive $3,484 and;
• For a $50,000 salary, you’ll end up with $3,060 back.

Whilst the above clearly shows that the higher the salary, the better you’ll do with the deductions, but in my view, it also shows the difference being relatively marginal once you earn over $80,000 a year.

What about the budget changes to depreciation? Well, our research finished right when the budget changes were announced in May 2017, but this made us best placed to model the impacts immediately. Our models were confirmed when we analysed the first 100 schedules we completed after the changes, and we found that;
• Our average depreciation deduction figure in the first year was $11,628
• The division 40 plant and equipment component equated to $6,870
• The division 40 structural component was $4,758

The prevalence of ‘budget affected’ clients is on the increase as anyone purchasing established property after the 9th of May 2017 is affected and will lose their plant deductions. However, we still see a significant number of schedules not affected simply due to clients not arranging a schedule upon acquisition. Eventually, these clients will fall away and what we’re left with is as a result, is that in the first full year of claim under the budget changes to depreciation, investors will lose 59% of their deductions for that year.
Now that’s the year were the loss is likely to be the starkest but remember that a house you build for $250,000 is likely only going to have $30,000 worth of plant and equipment items in it, so if you’re buying it second hand, at most we’re talking about a 12% loss of deductions over 40 years. However, the way that plant depreciates, it’s a big whack to the cash-flow for an investor upfront. It certainly decreases the incentives to purchase an established home or unit and coupled with proposed capital gains and negative gearing, we might see some real problems keeping rental increases below lackluster wages growth.

We look forward to sharing more data and contributing to an informed debate around property investors and the role of investors within our economy. Or at very least, pumping out data more effective at getting you into blissful slumber than prescription melatonin.

Why does your split depreciation schedule not add up?

Apologies for the click bait article title, but I was at a loss as to what to call it. Let me start by saying that split depreciation schedules are fantastic. I’ve written about them before: https://www.mcgqs.com.au/blog/split-depreciation-reports-are-saving-investment-property-co-owners-thousands/) and we’ve done thousands of them. They’re a fantastic way for multiple tenants in common to see their exact deductions, and more importantly, to front-load those deductions.

However, we’re asked on a frequent basis why the deductions won’t add up.

We prepare a master report (set out as if there is just one owning entity) and the split reports side by side (per owner) and provide them all to the clients as a means of comparison. I guess that’s where the problem arises as if you try to add up the year one deductions across the split reports, they won’t normally match the master schedule. This is something that both investors and accountants get confused by. The reason lies in the value the split schedule provides, over and above just looking at your share of the ownership.

Take for example the 100% rule. If you buy a property yourself and decide to add a ceiling fan that costs $280, you’ll be able to write the value off at 100% in the year of acquisition because the asset has an opening value of $300 or less. Now if that ceiling fan had a value of $320 dollars, you’d have to depreciate it over its lifespan. Now if you bought this property with your sibling say, you might have decided on a fifty-fifty split. So that means that your share of a $280 ceiling fan is $140. Again, this figure is under $301 for you so it’s an instant deduction. Where it gets interesting is if the ceiling fan was $320 as above, your share of the ceiling fan is $160. So, if you own this property at 50% you can claim the ceiling fan in one year if you own the property at 100% you cannot.

Given we know that the value must be $300 or less, your 50% share of the actual asset can be $300, which means the actual value of the fan could be $600 in total.
There are some things to be wary of such as the ‘set rule’ but that’s the easiest way to explain it. It works for low value assets as well as those that qualify for the low value pool at under $1,000 in value.

So below, here’s a look at an example split report next to a full report showing why the depreciation totals won’t match.

You can see that the total opening value is exactly half in the split report, but the year one deductions are almost as high in the 50% split as in the joint report, even though it’s only a half share. In this example, it’s due to the extra items that qualify for an instant deduction. You’ll note that the split system suffers from a lesser rate in the split report. This is due to pooled assets depreciating at 18.75% in the year of acquisition, and 37.5% each year thereafter. So, with that asset, it will underperform in year one but vastly outperform every other year. Therefore, preparing a maximised report requires an understanding of the client’s situation and goals, as sometimes a different approach can be taken.

If a client calls up and asks why $611 times two isn’t $823, this is the reason why. You can clearly see the way that a split report can front load those deductions. Sure, it’s the same value over 40 years, but most people aren’t holding the property that long and the cash flow position of a property is most likely to be worst at the beginning as the rent will rise over time.
Split reports might be a little more to get your head around but the benefits over the short term can be substantial.