Case Studies – Estimating costs of our very own Australian Solar Farms

In May 2019, Giles Parkinson titled an article “It’s not easy to build a solar farm in Australia any more”.

This was published on the Renew Economy website on the 16th of May 2019.

Mr. Parkinson goes on to state that albeit in the past, the powers to be believed it was easier to build a solar farm than a wind farm. Why the belief was that they were quicker to build, fewer hassles around the development application process and much fewer objections from neighbours.

“In Queensland, a rule from left field, or more specifically from the Electrical Trades Union, means that no one is too sure when the next solar farm might begin construction. The new rules introduced this week by the Queensland Labor government, at the urging of the ETU, mean that only licensed electricians can do much of the installation work, and it has stunned the industry”, notes Mr. Parkinson.

In addition to the opinions expressed by Mr. Parkinson, it seems that contractors used to build these solar farms are feeling the pressure. Or at worst, collapsed them. In recent months we have seen the collapse of RCR Tomlinson, one of the country’s biggest engineering and contracting firms in the solar farm industry.

Likewise, Tempo Australia has felt the pressure and suspended shares from trade due to cost blowouts on a farm under construction in Victoria.

Given that prediction by the Clean Energy Council of 50% renewable targets, it is going to be a hard push without these major players completing these farms.

Mr. Parkinson goes on to note that Ekistica recently illustrated the marginal loss factor of the four energy sources (Fossil, Solar, Hydro and Wind).

The graph shows how many of the fuels are sitting around 95% to 98% of their output gets paid. Whereas solar is struggling to stay above the 90% mark.

Image 1 - MCG Quantity Surveyors

This output rating is provided by the Australian Energy Market Operator (AEMO). The Marginal loss factor is the amount of output that gets credited to receive revenue. Meaning, in 2019, solar is currently rating at 0.9. This means that the average solar farm is getting credit for around 90% of it output.

“One solar farm, in Broken Hill, has been marked down to 0.75, which means only 75 percent of its output gets paid”, said Mr. Parkinson.

CEO of the AEMO, Audry Zibelman, says that the AEMO is doing all that they can, citing a cultural shift yet to be embraced as a major roadblock.

But for many frustrated solar farm developers, it is not fast enough. “What we are going to see is a pause,” said Morgan Stanley analyst Rob Koh.

On the ARENA website (Australian Renewable Energy Agency) it states that the cost of a Large Scale Solar (LSS) farm in Australian to construct has dramatically fallen over the years.

“The cost of large-scale solar PV has fallen dramatically in recent years from $135 per megawatt-hour (MWh) in 2015 to an expected $44.50 – $61.50 per MWh in 2020.”

This reduction was driven by a combination of international and local improvements and is expected to continue. International cost drivers include the cost of manufacturing, and local costs include the cost of finance and construction.

A megawatt is a unit for measuring the power that is equivalent to one million watts. One megawatt is equivalent to the energy produced by 10 automobile engines. A megawatt-hour (Mwh) is equal to 1,000 Kilowatt-hours (Kwh). It is equal to 1,000 kilowatts of electricity used continuously for one hour.

Case Study 1 –

MCG Quantity Surveyors were recently commissioned to provide feasibility costing on a Large Scale Solar Farm in QLD. The total cost of the development came to $14,000,000.

The five-megawatt, 16,000-panel farm produces electricity that is fed back into the grid.

This Solar farm project costs total – $2.80 per watt.

Case Study 2 –

MCG Quantity Surveyors were recently commissioned to provide feasibility costing on a Large Scale Solar Farm in NSW. The total cost of the development came to $9,848,025.

The five-megawatt, 16,000-panel farm produces electricity that is fed back into the grid.

This Solar farm project costs total – $1.96 per watt.

Interestingly, FG Advisory has recently provided a report to the Victorian Greenhouse Advisory to indicate the average cost per watt for the construction of Large Scale Solar farms. They average the cost to be $2.41 per watt.

Image 2 - MCG Quantity Surveyors

In addition to this, the finding was based on reviewing 13 Large Scale Solar Farms, already constructed, they found the average to be $2.41 per watt.

Image 3 - MCG Quantity Surveyors

Written by Marty Sadlier
Founding Director and Owner at MCG Quantity Surveyors

Building approvals point to a potential future housing shortage

It doesn’t seem that long ago we were talking about an oversupply of apartments across Sydney, South Melbourne, and Brisbane. However, a lot has changed in the past few years. The ABS October figures on building approvals show a seasonally adjusted estimate for total dwelling units falling by 8.1% in October. The graph below from the October ’19 ABS figures paints a vivid picture of what’s been happening to approvals since 2018.

Building approvals point to a potential future housing shortage - MCG Quantity Surveyors

(Source: ABS 8731.0 – Building Approvals, Australia, Oct 2019)

The lag between rate cuts and building approvals grows ever larger and ANZ are claiming a potential future housing shortage. ANZ senior economist Felicity Emmett sees vacancy rates declining over 2020 and 2021 with approvals not picking up until mid-2020.

It sounds as though ANZ are not quite out on a limb, given that the Reserve Bank deputy governor Guy Debelle in fact considers a shortfall in housing supply as “quite likely,” with the end result being a “larger price response” in property values.

He further stated that “While the increase in supply has finally met the earlier increase in demand, demand will continue to grow given population growth, but supply is going to decline. So, there is quite likely to be a shortfall again in the foreseeable future.”

Higher density construction is subject to longer lead times, so the supply response is always going to be slow. This further exacerbates any potential supply issues on the horizon.

Construction activity has a solid impact on GDP and the CBA estimates that the full downturn would cost the economy 1.4 percentage points worth of overall growth.

The effect of tighter lending standards for developers is surely part of the puzzle, but it’s mixed in with a weaker demand from would-be purchasers over the last little while and some of the concerns over the quality of newly constructed apartments.

It seems that 24 months is a long time in construction and real estate, and the supply and demand fundamentals look to seesawing in the other direction. Along with the Government and RBA, we’ll be watching with keen interest.

Written by Mike Mortlock
Managing Director of MCG Quantity Surveyors

Wrapping up the year with Data, Dance Floors, and Depreciation

Our year started on a high, coming off the back of a massive win for MCG. Landing a position on the Financial Review’s top 100 of fastest-growing businesses, we hit the ground running!

Mike Mortlock and Mitch Ford completed their much-anticipated triathlon, with over $2k raised for Heartkids, a charity helping those affected by congenital heart disease.

Mike smashed it and beat Mitch in Foster, which was expected with the large amount of trash talk happening in the office leading up to the event. Overall, they both demolished their own expectations and there were smiles and heat rub creams all ‘round.

We then attended the Accounting Business Expo in Sydney, where we mingled with accountants and business pros alike. The event is always a great chance to present on stage and chat all things depreciation. We’ll be back next year, so keep an eye out.

During May the election came and went, which honestly feels like a whole two years ago and undoubtedly has me thinking how long this year really has been.

But the election provided great opportunity to get our data nerd hats on and didn’t we flourish, (our nerd hats are always on, let’s be honest). 

With the Labor Party pitching to abolish Negative Gearing if they were to win power, shadow treasurer Chris Bowen suggested that investors buying brand new comprised anywhere between 4 and 14 percent of the total numbers. Our ears pricked up and we analysed data going back to 2016, finding that 43 percent of our investor clients bought or built brand new housing. This data with additional evidence from mortgage aggregator AFG led to a more sophisticated debate based on accurate data, so we threw around a couple of high-fives in honor of this small win and the media covering the story with our industry-first data.

On top of the dampening effect on property that an election tends to have, APRA also made some tweaks to their investor requirements and serviceability floors. Combined with low-interest rates, the back end of the year saw an increase in housing activity and auction clearance rates.

(I’m still trying to work out why at this point, but some people on LinkedIn kept mentioning it, and Mike posted some videos too.)

In June, Director Marty Sadlier took on the cold weather in Sydney to help change the lives of Australians experiencing homelessness.  A record 7.9 million dollars were raised to help break the cycle, with some solid efforts from Marty raising much-needed funds as well. Marty also added ‘Social Media Specialist’ to his resume and was given unrestricted access to the MCG social media accounts. All 3 of his fans tuned in to get live updates on the event as Marty talked about how cold it was, as well as shedding some light on the significance of supporting Vinnies and Australians who are doing it tough. We’re very proud of Marty, and we are sure to see him again in his cardboard box in 2020.

The 1st of July saw the first real major changed to residential effective lives since 2004. It’s truly a moment of reflection on your interests when you can record a 3-minute video and a blog for API on carpet having a new effective life of 8 years.

New thresholds also came into play for businesses. Businesses with a turnover less than $50 million are now eligible for the instant asset write-off of $30,000 (depending on when you bought the asset).

Not content with our nerdy data analytics wins thus far, we dug into some more data and found that property investors not claiming deductions in a timely manner, are missing out on deductions of $20,537 on average.

And, if that wasn’t specific enough, if these results are extrapolated across the nation’s total investor population missing out on claims, (potentially 140,525) this equates to a total potential loss of $2,885,967,347 in missed depreciation overall. Yep, over 2 Billion Aussie dollars! That’s a hell of a lot that we could have had in our back pocket.

The last months of 2019 have flown by, which usually happens after tax time, it’s just all downhill from there. However, we attended some rather educational events, which allowed us to get out in the real world and show off our moves. I was using this metaphorically, but then I remembered our MCG team on the literal dance floor at the annual Bean Counters Charity Ball in October. A Depreciation and Estimating specialist that can dance is a real niche.
We spoke at the Real Estate Buyers Agents Association 2019 Conference, which draws Australia’s best and brightest property buyers together. Then backed it up with the first ANZ Property Investment Seminar, an informative chance for property investors to see the process from A – Z. Yep, all the way to the tax depreciation guy. 

Wrapping up a big year we had some more healthy exposure in the media, this time with Australian properties being underinsured. Marty brought out some new research showing that some homeowners could be underinsured by 66%, heightening the risk of financial losses as Australia launches into bushfire and flood season. Our analysis showed that property owners relying on web-based calculators by insurance companies could be finding themselves coming up short. Another win for our team, and more importantly Marty’s cost planning squad.

That’s about it from us in 2019, and if you’re still reading, we appreciate the support. We also wish you all the best as we head into the new decade, I’m sure it’s going to be a hoot! We look forward to bringing some more moves to the D-floor and some nerdier data stats.

Enjoy the festive season and stay safe. Our offices will only be closed on public holidays. Cheers!

Progress Claim Case Study – The MCG Method of Assessment

As part of the services of quantity surveyors, we are regularly commissioned to undertake progress claim assessments on behalf of financial institutions.

During the last month, we have seen quite a common conversation held between ourselves and a client (developer) regarding the difference between our assessment of the builders claim and the amount that the builder was claiming for.

It will be no surprise to many of you, our quantity surveyors assessment of the builders claimed amount was less than that claimed for by the builder.

Are we harsh, or is this a reflection of two different methods of assessment and claiming for works completed to site?

It is the latter.

In the scenarios that I am referring too last month, we had four (4) builders indicate to ourselves and the developer that they would be ceasing works on the site until there progress claim had been paid in full.

In these instances, the builders had submitted their progress claims as per the signed construction contracts, as Staged Progress Payments or Milestones.

These contracts were either Master Builders Association contracts (MBA) or Housing Industry Association contracts (HIA).

The builder will nominate percentage values to each of the stages, with a common break up being:

Deposit – 5 %

Base stage – 10 %

Frame stage – 15 %

Lock Up stage – 35 %

Fixing stage – 25 %

Completion – 10 %

Total – 100%

From the client or developer’s perspective, they had sought funds from a financer, which was based on the release of funds being assessed by a quantity surveyor and based on ‘works completed to site’.

In these four (4) scenarios, there were two (2) reasons for the difference in the assessment of the progress claim value.

The percentage nominated as being completed to site ‘Frame Stage’ was much higher than the value of the works completed to site.

Works had not been completed to site that fulfilled the definition of the milestone.

In the issues surrounding the overstated percentage for a particular milestone (Point 1), the percentage of the contract value that is claimed each time is not a reflection of the actual works completed to site. The builder will have increased the value of each of the stage percentages so that they can fund deposits and long-lead materials for the future works and stages. For example, with the 10% of the base stage funds claimed, so of those funds will be used for the securing of timber wall and roof frames deposits and window deposits.

The risk to the client is that in the event of the Builder or building company going under or leaving the project, there may or may not be enough funds left to successfully finish the project.

However noting this, the construction contract that notes milestones is still a legally binding document.

Therefore, in these cases, the discrepancy between the claimed amount and the assessed amount has forced the client to put their hand in their pocket to make up the difference between what the financier will pay and what is written in the building contract.

This shortfall of funds will take some time for the client to get to the builder, in turn, delaying the program by a few days.

With the scenario of point 2, although our assessment of the works was based on works completed to site, the client was not required to pay the builder any funds as they had not completed the works as defined in the contract as being required to fulfill the milestone.

The builder had claimed for ‘Fixing Stage’. The contract defined fixing stage as:

Fixing Stage – “means the stage when all internal cladding, architraves, skirting, doors, built-in shelves, baths, basins, troughs, sinks, cabinets and cupboards of home are fitted and fixed in position”.

However, freestanding baths had not been placed in position and basins had not been installed to the stone benchtops on some of the vanity units.

In this scenario, the builder really should have considered the types of fixings and fittings specified for the development and considered modifying the wording of the milestone or moving some of these items to the final stage definition.

It is no secret that obtaining finance is still a stumbling block for developers in the current economic climate, so our advice is that understanding the constraints and potential funding issues that a development may face is absolutely paramount.

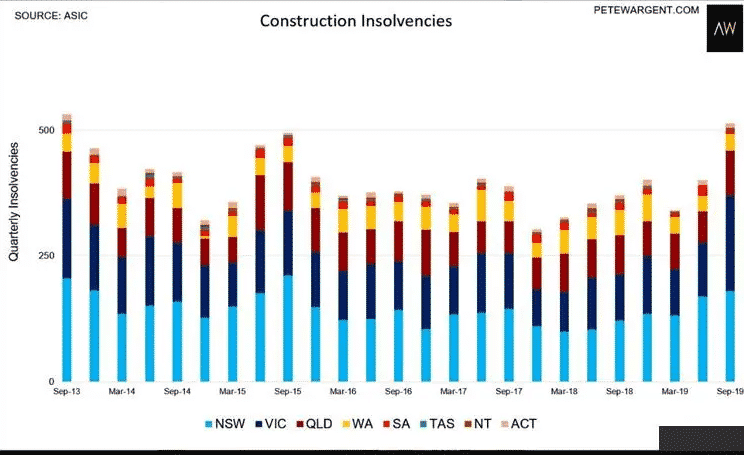
New figures show the housing slowdown is biting NSW hard, with the number of construction companies going under last quarter hitting its highest level in almost four years.

Statistics provided by ASIC show 169 NSW-based construction companies went into administration, receivership or a court-ordered shutdown in the June quarter. This is the highest number since the September quarter of 2015.

Over the whole 2018-19 financial year, 556 construction companies went under — 101 more than the previous financial year.

Mr. Hathway, Association of Independent Insolvency Practitioners president and who also runs his liquidation firm, said small construction companies had been hit hardest.

Stephen Hathway said there was no doubt the industry was “stressed”. “These days it’s subcontractors on subcontractors,” he said.

“And the general feel I’m getting from talking to my fellow liquidators, is that in the building industry subbies just slow down paying the little ones (construction companies).

Sure, there are various reasons why construction companies fail. However, cash control and the timing of funds coming in are a major contributor to the issues.

Capture - MCG Quantity Surveyors

More and more reason to be fully aware of how funds are to be paid to you by either a developer or financier.

Understanding the potential pitfalls or bottlenecks pertaining to progress claim funding will allow builders and developers to avoid exposing themselves to these risks.

Written by Marty Sadlier.

Marty is a property investor, cost estimation specialist and Director of MCG Quantity Surveyors. His passion is ensuring that developers and investors alike gain a comprehensive understanding of all construction costs and potential risks on their developments. Marty’s mission is to assist property developers to achieve financial security through accurate construction consultancy services. You can visit them at www.mcgqs.com.au/

Bushfires & Floods – The cost of a Natural Disaster to home owners

Australian Research

In 2000, the Construction Data division of Reed Business Information Systems (Reed) surveyed 1000 randomly selected homeowners. They concluded that:

  • 87% of homes were under-insured by any amount
  • The average level of under-insurance was 34%

In 2002, the Insurance Council of Australia conducted a survey of seven companies sharing 80% of the home building insurance market. The survey suggested that:

  • 5% of homes were under-insured by 10% or more, and
  • 5% of home buildings were under-insured by 30% or more

In 2003, the Royal Automobile Club of Victoria (RACV) found that consumers do not increase the sum insured following improvements to their homes. The survey found:

  • 24% of consumers did not increase the level of cover after renovations costing between $20,000 and $40,000.

In 2003, bush fires caused death, injury and destruction of property in the ACT. A total of 488 homes in and around Canberra were destroyed.

However, many insured homeowners found that their building insurance policies did not meet the full cost of rebuilding their home and associated expenses. They found, they were underinsured.

The Insurance Disaster Response Organisation reported that structures destroyed in the ACT bushfires were underinsured, on average, by 40% of the replacement cost.

Respondents to ASIC’s ACT bushfire survey were asked how the sum insured under their home building policy was initially calculated. The results found:

  • 51% estimated the sum insured themselves
  • 23% reported using information from an insurer to help them
  • 80% saying they believed they were adequately insured


Queensland Floods

On the 11th January 2011, the then premier of Queensland, Anna Bligh, declared three quarters of Queensland a disaster zone as the State was affected by one of the most severe flooding events in its history.

About 15,000 properties were affected by significant flooding, with 5,000 businesses affected. In Ipswich a further 3,000 homes and businesses have been flooded. The Local Government Association of Queensland estimates that 70,000 to 90,000 km of council roads have been damaged (councils are responsible for 80% of roads).

IBIS World also expects approximately $1 billion to $2 billion in additional spending on commercial and institutional premises would be needed in the following 2 years of the event. The damage to these buildings was partly contained by greater use of concrete and steel, as distinct from the timber and plasterboard of most residential housing.

However the Reconstruction cost was estimated at some $10 billion. (Jan 2011 IBIS World)

The Queensland floods were followed by the 2011 Victorian floods which saw more than fifty communities in western and central Victoria also grapple with significant flooding.


Victorian Floods

It was recorded that high intensity rainfall between the 12th –14th January 2011 caused major flooding across much of the western and central parts of Victoria.

This, along with follow-up heavy rainfall from events such as Tropical Low Yasi, caused repeated flash flooding in affected areas in early February in many of the communities affected by January’s floods.

As at the 18th January, more than:

  • 51 communities had been affected by the floods
  • Over 1,730 properties had been flooded
  • Over 17,000 homes lost their electricity supply.
  • 51,700 hectares of pasture and 41,200 hectares of field crops flooded
  • 6,106 sheep were estimated to have been killed

The Department of Primary Industries later calculated a damage bill of up to $2 billion.


New South Wales Bushfires

The New South Wales Rural Fire Service notes that the 2012-2013 Christmas period witnessed large parts of NSW  affected by bush fires brought on by searing temperatures and wild winds.

The RFS has confirmed 33 properties and more than 50 sheds have been destroyed, as well as machinery and there have been extensive stock losses in the bush fire west of Coonabarabran, which also damaged the Siding Spring Observatory. The fire in the Warrumbungle National Park in the north-west of the state had burnt out nearly 40,000 hectares and has a 100-kilometre-wide front.

More than 170 fires continued to burn across the state at that time

In Tasmania, a Victorian fire fighter had died while fighting bush fires that have destroyed about 170 properties.

Recent Disasters Table

Recent Natural Disaster Total Cost
QLD Cyclone YASI  $            1,412,239,000.00
QLD Flooding  $            2,387,624,000.00
SW QLD Border Flooding  $               131,432,000.00
NSW & VIC Flooding  $               131,890,000.00
VIC Flooding  $               126,495,000.00
VIC Christmas Day Storms  $               728,640,000.00
VIC Severe Storms  $               487,615,000.00
WA Perth Bushfires  $                 35,128,000.00
WA Margaret River Bushfires  $                 53,450,000.00
Tasmanian Bushfires  $                 86,700,000.00
NSW bushfires (Coonabarabran region)  $                 12,000,000.00
Total  $            5,593,213,000.00


Most common building defects in residential multi-owned properties

In a recent research paper pertaining to the examination of building defects in residential multi owned properties, there has been some great findings. These findings were authored by Nicole Johnston (Deakin University) and with Sacha Reid (Griffith University).
In summary, two studies have been undertaken to identify the most common building defects in residential multi-owned properties. The studies were both conducted by the same group of researchers (Easthope, Randolph and Judd).
The first study conducted in 2009 found that the most common defects identified by lot owners were water ingress, internal and external wall cracking, roofing and guttering problems and tiling faults.
In 2012, anchored off the original study, the researchers surveyed a larger owner cohort where respondents identified water leaks (42%), internal and external wall cracking (42%), exterior water penetration (40%), guttering problems (25%), defective roof coverings (23%), plumbing faults (22%), and tiling related defects (20%).

In the interest of endeavouring to find out why these defects are ever present; attempts have been made by the researchers to identify the stages (in development) in which defects arise.
Interestingly, and of a surprise to me, the study showed that 50% to 60% of building defects are attributed to design issues and would have been preventable with better design. Therefore, concluding that some 40% to 50% of defects arise in the construction phase.
Furthermore, of the percentage of defects that were attributed to the findings, some 32% originated in the earlier phases of development (including design), approximately 45% originated on site and remaining approximate 20% related to materials and machines.
It appears that data was collated from various building consultants and auditing companies, with the breakup of theses providers noted as follows; some 99 x report providers from NSW, 66 x report providers from QLD and 47 x report providers from VIC.
Similarly, an additional method of further drilling down to gain a deeper understanding of the prevalence of these defects was to interview these stakeholders. With some 21 interviews conducted across the 3 states, with a guide provided to them with the questions based on review of the literature. Of these 21 interviewees, lawyers and committee members made up 12.
In the process of the data collection, and by a way of summarising the findings, it was noted that many of the interviewees suggested that human error played a significant part in the building defects. This human error was largely summarised as misuse of building products (due to lack of knowledge), poor workmanship, time pressures (cutting corners), poor supervision, lack of training, lack of licensing and trade accountability.

Having noted this, further observations (mainly two recurring observations) were made by the interviewees regarding organisations factors that contributed to building defects and the prevalence of the building defects. The first recurring observation was the motivation to make a profit and the second was time pressures that resulted in mismanaged process time allocation and co-ordination of trades.
When questioning surrounding the use of Private Certifiers was raised and if Private certification systems were flawed, the general consensus of the 12 x lawyers and committee members was that the system was deeply flawed, with committee members raising more pointed concerns that the private certifying system was not only conflicted in their interests but their documents were at times fraudulent.
In what I found to be staggering, one of the interviewees, a private certifier, noted that “it is not feasible to inspect every element of the building either before or after construction”. With the certifier adding “Responsibility must be on all those involved in the building process”.

An Expert Witness Case Study – Owner V Builder, August 2019

In a recent expert witness case that I was asked to provide my opinion of costs on, the result has now been published.

Background
The background to both applications is best described as:
The Owners’ sought damages from the Builder in respect of:
o (Item 1) Defective and/or incomplete works (the Defects Claim);
o (Item 2) Delay (the Delay Claim); and
o (Item 3) Breach of contract giving rise to excessive costs being charged (the Costs Claim).

The Builder’s response (in summary:

o Of the Owners’ defects claim, the Builder accepted liability for $26,830.78 of defects.
o The builder offered to settle the Defects Claim for $30,000.

To aid the tribunal in them being able to resolve the dispute, 4 x expert witnesses were appointed, one being myself (engaged by the Builder).
Item 1 – As a result of a conclave of experts, the Defects Claim was reduced to $67,983.83. However, of these defects, some were still in dispute as to if they were in fact a defect or not (8 in dispute).

At the beginning of the hearing, eight items in the Scott Schedule remained in dispute. During the hearing the parties reached agreement on four of the disputed items, and the claim in respect of the remaining items in dispute was determined.


Conclusion

Item 1 – The Owners were awarded damages in respect of agreed defects and damages in respect of one of disputed items.
Item 2 – The Delay Claim was wholly successful.
Item 3 – The Costs Claim was wholly unsuccessful.

Tribunal Orders
The Tribunal relevantly made the following orders:
o The Builder was to pay the Owners the sum of $31,255.73 immediately.

In hindsight, the builder had provided a reasonable offer prior to any court proceedings starting.
In the words of the tribunal, pertaining to the builder’s original offer of $30,000:
“This represented a genuine offer of compromise. The offer was open for a reasonable period and it was unreasonable of the Owners not to accept it.”

In closing the tribunal also noted:
“In my view, both parties had a substantial degree of success in the proceedings. The proceedings therefore had a mixed result. I am satisfied that the proper exercise of the costs discretion in this case is for each party to pay their own costs.”

It is therefore, in my opinion, if the original offer was in fact accepted by the owners, many hundreds of thousands of dollars of legal fees would have not been incurred by either party.
In addition to the extraordinarily high legal fees that both parties experienced, this matter took several years to come to finality.

MCG insights into property investor behaviour that you need to know

Since we started preparing depreciation reports for property investors back in 2011, I wanted to collect data that I thought would illuminate the property industry as to the types of acquisitions the average property investors was making. Through the course of doing what we do, we also have to ask some fairly unusual questions that are pretty specific to our reports, but these questions can shed some light into investor behaviour as well. Most notably, our findings on investors living in their property prior to renting it out (https://www.realestate.com.au/news/1-in-5-firsttime-landlords-are-accidental-investors/)

Let’s look at some of the top-level data we’ve collected. Through our analysis of 1,000 residential depreciation schedules, we found that property investors are split across each type of residential property in the following way;
* 43.1% of investors either buy or build a house
* 8.5% on investors purchase a townhouse or duplex
* 47.3% of investors purchase a unit
* 38.2% of all investors buy something brand new

So, if you add townhouses and duplexes into the ‘house bucket,’ you’ll see that it’s a fairly even split. Now that we’ve identified the split, we’ll be tracking the numbers with interest.
If we dive into units individually, we’ve found that;
* The average number of units within the development investors are purchasing in is 68
* The average purchase price for investment units across the 473 units studied was $539,570
* 43% of units are bought brand new compared to only 26.2% of housing being bought new. This figure for houses drops to 7.3% if we exclude investors who engage a builder directly.

Clearly, we’re seeing the prevalence of off-the-plan purchases here and it will be interesting to see how these purchase prices hold up over time.

Now let’s look at some average deductions. In our research, we found the average depreciation deduction within the first full year of claim was $9,415. According to the ATO tax calculator, this gives you the following back in your pocket;
• On a $200,000 salary, you’ll receive $4,237 back in your pocket
• On $100,000 you’ll receive $3,484 and;
• For a $50,000 salary, you’ll end up with $3,060 back.

Whilst the above clearly shows that the higher the salary, the better you’ll do with the deductions, but in my view, it also shows the difference being relatively marginal once you earn over $80,000 a year.

What about the budget changes to depreciation? Well, our research finished right when the budget changes were announced in May 2017, but this made us best placed to model the impacts immediately. Our models were confirmed when we analysed the first 100 schedules we completed after the changes, and we found that;
• Our average depreciation deduction figure in the first year was $11,628
• The division 40 plant and equipment component equated to $6,870
• The division 40 structural component was $4,758

The prevalence of ‘budget affected’ clients is on the increase as anyone purchasing established property after the 9th of May 2017 is affected and will lose their plant deductions. However, we still see a significant number of schedules not affected simply due to clients not arranging a schedule upon acquisition. Eventually, these clients will fall away and what we’re left with is as a result, is that in the first full year of claim under the budget changes to depreciation, investors will lose 59% of their deductions for that year.
Now that’s the year were the loss is likely to be the starkest but remember that a house you build for $250,000 is likely only going to have $30,000 worth of plant and equipment items in it, so if you’re buying it second hand, at most we’re talking about a 12% loss of deductions over 40 years. However, the way that plant depreciates, it’s a big whack to the cash-flow for an investor upfront. It certainly decreases the incentives to purchase an established home or unit and coupled with proposed capital gains and negative gearing, we might see some real problems keeping rental increases below lackluster wages growth.

We look forward to sharing more data and contributing to an informed debate around property investors and the role of investors within our economy. Or at very least, pumping out data more effective at getting you into blissful slumber than prescription melatonin.

Tax depreciation estimating – The value of having your finger on the pulse

Back in the day, tax depreciation was not a service that quantity surveyors offered. In fact, it’s an industry that’s not much older than 21 years whereas quantity surveying in general can be traced back to at least 1859 but possibly 1785. Sorry, you’re right, you didn’t ask. Anyway, my point is that most quantity surveyors don’t do tax depreciation. The largest QS companies in Australia and abroad are traditional quantity surveyors that are more specialised in estimating, contract administration and project management than depreciation. Most established firms that specialise in depreciation once started in traditional estimating but moved over to the tax side of things and abandoned that service. There are surely also companies that popped up just doing depreciation. That’s all very well, but I think both are neglecting a key advantage to maintaining a traditional estimating department.

There are probably three factors that merge to assist an estimator. Experience, cost databases/libraries and current project data. Companies that don’t maintain an estimating department are missing the third component. Here’s why that matters.

In our business for example, I’m the tax depreciation guy. I’ve done it for as long as I dare admit and we run a department that specialises only in tax depreciation. On the other side of the business are our traditional estimators. One of the key differences is that on the tax side, we’re almost exclusively working on projects that have been already built, and often built tens of years ago. On the estimating side, they’re almost exclusively working on things that are about to be built or are coming out of the ground right now. The tax side of the business benefits hugely from that.

Why? Simply because the cost data we have access to is minutes, hours and days old, rather than months and years old. Working in cost control for current projects under construction gives us access to progress claims that developers are making to the banks, showing us the details of what each stage of the building is costing them. It goes right down to the individual trades too where we can see how much painting costs per square meter and how much the labour component of carpentry is costing for example. Without this information, we’d be relying on cost databases that come out yearly at best and due to the pace of price movements in Australia, the costs are technically already out of date.

It’s true that the tax side of our business does work on projects where the total construction cost is already known, but based on the data gathered within the system, that only happens 14.3% of the time. Even when it does, the level of detail often never goes past just the total cost.

I guess there’s a lot of ways to spin your point of difference, but I firmly believe that working with a firm that has a traditional estimating department presents real advantages on the tax depreciation side, and in turn, better depreciation.

Timely reminder to home owners – Watersun Homes Collapses

The headlines are reading, ‘Home builder goes under, Thousands lost, Hundreds of home owners left out of pocket’.

The reality is that we have all read these headlines before and unfortunately, these brutal words will continue to feature from time to time within the construction landscape.

Building your home is a personal thing, whether it be the family home or an investment. Like our health, we live by the adage that ‘it will never happen to me’.

Wrong. As recent as this week, some 300 home owners are expected to be left out of pocket with the collapse of Watersun Homes.

As the Geelong Advertiser reported on the 1st March, the directors of Watersun have gone into hiding, whilst the home buyers have been left in shock.

I expect the question on the minds and lips of many of the 300 home buyers after Watersun’s collapse will be, What to do next?

Know your numbers. What have you paid in construction cost progress payments to the builder?  What is your cost to complete the construction works?. Then, are these numbers correct?

You may well have been paying the builder under a milestone method or staged method, similar to the below. However, that may well be very different to the ‘actual’ cost of the works completed to site.

Ms blog - MCG Quantity Surveyors

For example on your $400,000 construction cost, you have paid the builder up to and including the frame stage. That is some 50% of the contract sum, $200,000.

However, what has actually been completed to site would be more in the order of 25% or $100,000.

Why? The above milestone method is front loaded to allow the builder to pay deposits for building materials, suppliers and subcontractors. In many cases, these deposits and building materials have not even been provided yet, or have reached site.

In a nut shell, you have $200,000 left as your cost to complete, but that will not be enough to complete the project, you actually would need closer to $300,000, plus the cost of a new builder establishing to site, engineer’s inspections, etc.

My advice? Contact a Quantity Surveyor to estimate the actual construction cost, then conduct a site inspection to determine the actual cost of the works completed and fixed to site. This will give you an accurate ‘actual’ cost to complete the development.

Secondly, you have the option of insurance. This is why it is vital that your home builder provides copies of these to you. I’m referring to Home Owners Warranty Insurance.

A word or warning though, going down the rabbit hole of insurance, will be a slow and at times, tedious process.

Choice, Australia’s leading consumer advocacy group, noted that:

“If your builder does go broke, die or disappear before the complaint is resolved and you have to resort to your home warranty insurance, it won’t cover legal costs against the builder. These costs can easily exceed the amount you’re attempting to recover – in one case cited by the Consumer Action Law Centre, a claim for $63,000 incurred about $90,000 in legal fees.

In addition, Choice went on to note “The Victorian Managed Insurance Authority has reported that Victorian homeowners paid about $87.8m in home warranty insurance premiums from May 2010 to May 2011, but only $108,000 was paid out on a total of three successful claims. Over the same timeframe, about 250,000 Victorians suffered damage at the hands of Victorian home builders”.

Thirdly, if patience can be maintained, a potentially better prospect will be to hold out and let the dust settle. There would be a good chance that a knight in shining armour is around the corner. This knight may be another building company willing to take on the task of finishing the buildings and continue to lead you on the path of having a completed project.

Regardless, knowing your numbers will be vital. If you are wanting to and willing to negotiate with the new builder, you will need to know what the ‘actual’ cost of the remaining works are.

My advice? Get hold of a qualified Quantity Surveyor and ‘KNOW YOUR NUMBERS’.

Marty is a founding director of MCG who specialise in traditional construction cost estimating and maximising the depreciation deductions for property investors and businesses across Australia.Marty has over 18 years experience in the building and construction industry. Marty has been called upon many times as an expert witness, sits on the interviewing panel for Australian Institute of Quantity Surveyors (AIQS) and works closely with financiers and developers across Australia.