Combined Capital City Dwelling Values up, led by Sydney & Melbourne
Sydney and Melbourne continue to post strong results, showing a consistent 1% growth per month in dwelling values, with the sum of regional areas relatively flat.
In Sydney and Melbourne, cumulative growth in dwelling values over the cycle (June 2012 to date) now stands at 64% in Sydney and 44% in Melbourne.This result highlights the differences in growth trends across the capital cities over the same time period. Outside of Sydney and Melbourne, the third highest rate of capital gain over the cycle to date was in Brisbane at 18%, and was as low as 4% over this same period in Darwin.
Index results as at August 31, 2016
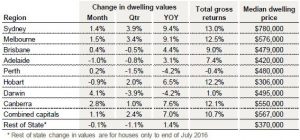
CoreLogic head of research Tim Lawless said, “Despite a strong month-on-month reading, the pace of annual capital gains has trended lower compared with the 2015 peak in growth conditions, when capital city dwelling values were rising at 11.1% per annum.”
“The most recent twelve month period has seen dwelling values rise by a lower 7% per annum. However, the rate of annual growth in Sydney has virtually halved from a recent 18.4% peak to the current annual rate of 9.4%. Similarly, in Melbourne the annual growth trend peaked at 14.2% per annum last year and has since tracked back to 9.2% per annum over the most recent twelve month period.”
Perth and Darwin remain as the only capital cities to record a fall in dwelling values over the most recent twelve month period, declining by 4.2% in both cities. Mr Lawless said, “Softer economic conditions and a significant fall in overseas migration rates, together with an increasing net outflow of residents to other states and territories, has made a substantial dent in housing demand. This has resulted in corresponding declines in both dwelling values and rental rates.”
Demonstrating the decrease in housing affordability, utilising household income data for the June quarter provided by the Australian National University, the household income to dwelling price ratio was 8.4 in Sydney and 7.2 in Melbourne, compared to 5.7 in Brisbane. Prior to the current growth phase, affordability ratios were much lower, with Sydney and Melbourne both showing a dwelling price to income ratio of 6.7.